


Canadian Dollar Talking Points:
- While the U.S. Dollar has been eviscerated against currencies like the Euro or British Pound, USD/CAD has held up well on a relative basis.
- The 1.4500 level has continued to constrain bullish breakouts so far and that sets the stage for possible mean reversion on a bigger picture basis. But, first, bears would need to take out higher-low supports which they’ve seemingly failed to do despite ample opportunity.
- Given the tenuous tariff topic combined with a DXY that’s been showing oversold conditions, bullish breakout potential cannot be ruled out but the bigger question on the long-term range is the monthly close, explained further below.

Technical analysis isn’t great for predicting new events, at least in my opinion. This may sound oxymoronic as a lead sentence in an article about a forecast, but we might as well address the elephant in the room. Technical analysis is an examination of the past and as such, it can really only operate within the confines of extrapolating that past on to possible future events. Where I think technical analysis shines is with risk management, and strategy, in the ability to insert ‘if-then’ statements that can allow traders to find possible asymmetry, allowing for larger reward targets relative to risk outlay. So, if the past does have some role in how the future plays out, the whole ‘history may not repeat, but it can certainly rhyme,’ well then using those waypoints of the past can be helpful in looking to strategize with that asymmetry in mind. And for traders, I think risk management is a more important topic than prediction.
If you’d like to read more, I talked about this in-depth in the article Technical Analysis Does Not Predict the Future (but it Can Help with Risk Management).
Where technical analysis lacks is in predicting new ‘things.’ You can use technical analysis to highlight breakout potential, such as I had looked at in late-January. At the time Canadian tariffs were set to come into place on a Saturday and the pair had already driven up to a fresh high. Given the likely low liquidity backdrops of a Sunday open, combined with the pandemonium around the tariff topic, it seemed probable that a breakout could show, and it did.
But getting the exact top or the exact bottom is expecting too much, in my opinion, and I think the inability of the past to perfectly predict the future is one primary reason that some traders dislike or besmirch technical analysis.
I say all of this to point out the fact that there’s a historical pattern that remains in-play in USD/CAD but that may soon be broken. I’ve been highlighting the nine-year range in the pair since back in November, when the tariff topic first came into play and USD/CAD was struggling to hold above the 1.4000 level. Normally, with a range of this magnitude, the wide expectation would be for continuation, and so far, over the past three and a half months, that’s what’s taken place.
But buyers haven’t given way and given the current backdrop, we may be in one of those situations where a breakout setup, or ‘something new,’ may be brewing around the next corner. It’s not too late for bears to take over, to be sure, but their window of opportunity seems to be narrowing, and some contributing factors are pointing to the possibility of a bullish breakout to fresh highs in the pair, which I’ll elaborate on below.
USD/CAD Monthly Chart: The Range
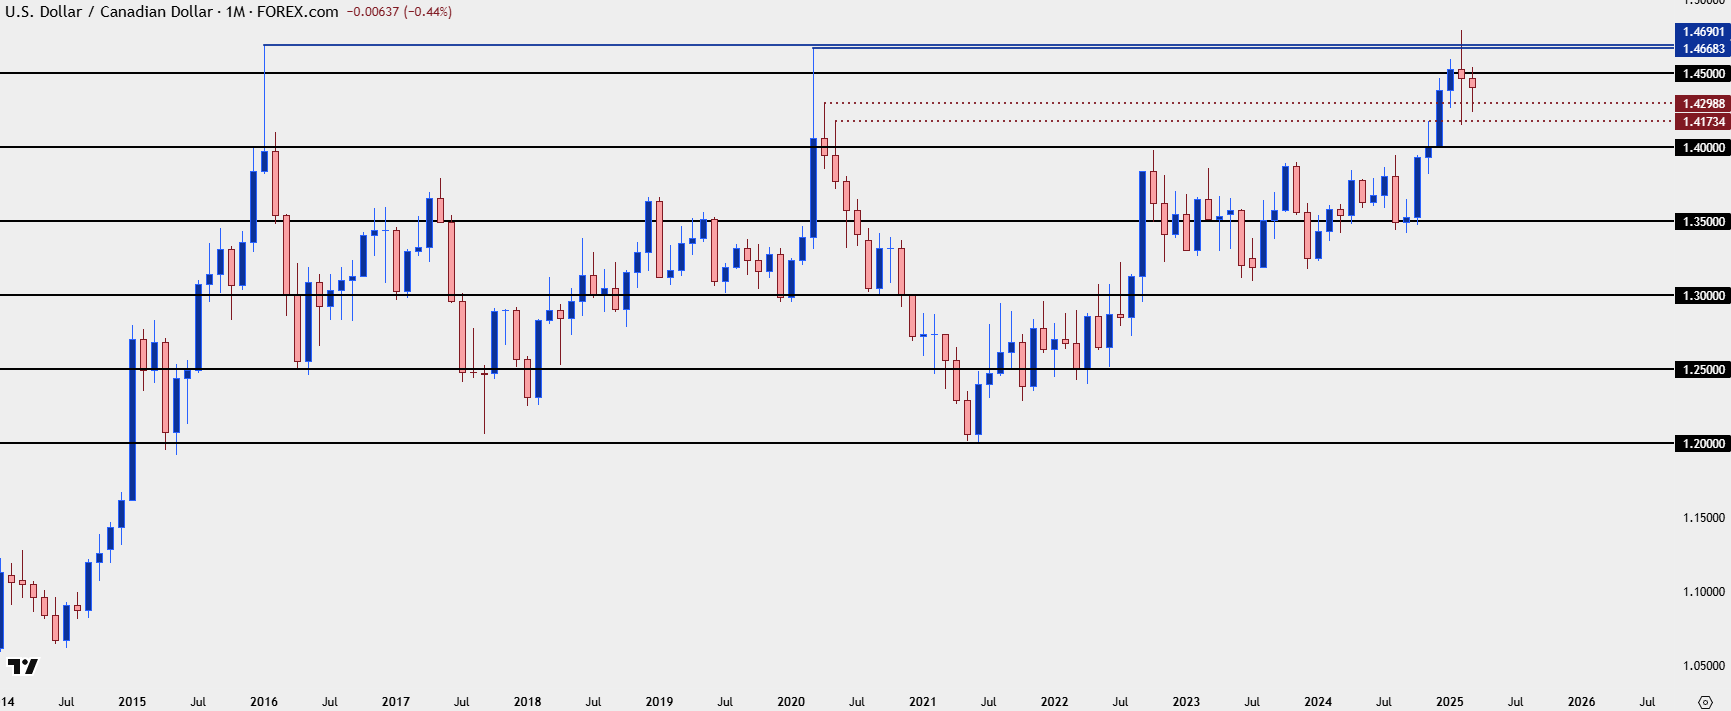 Chart prepared by James Stanley; data derived from Tradingview
USD/CAD Digestion
Ever since the spike in USD/CAD in early-February, it’s been a digestion pattern building in the pair. The 1.4500 psychological level has continued to loom large, holding back two separate breakout attempts from bulls.
Normally that would be a bearish factor, especially considering the longer-term chart looked at above. But the other side of that argument is the fact that higher-low supports have held from each pullback going back to mid-February. And notably, those higher-low supports have printed around some relevant longer-term prices, as the 1.4173 that held the lows for a week in February were a prior lower-high from the last test above 1.4500, and the 1.4298 level that’s helped to hold the lows so far in March was from the lower-high before that.
The past six weeks of price activity can be expressed as a symmetrical triangle with both lower-highs and higher-lows; and normally that doesn’t come with a directional bias. But, when paired with the prior bullish trend, that triangle can be considered as a bull pennant formation.
There’s also the matter of the U.S. Dollar to consider, which has been mired in an aggressive sell-off so far in March, and DXY has flashed oversold conditions on the daily chart over the past week. That’s the first time for such an occurrence in DXY since August of last year. It took about a month but, eventually, the US Dollar launched into a massive bullish trend that ran through Q4 and into the New Year. So while RSI may not be a great timing indicator, it does deliver some important context and chasing an already-oversold US Dollar lower can be a stiff challenge at the moment.
If the U.S. Dollar does strengthen, that could finally give USD/CAD bulls the motivation needed to push through the 1.4500 handle, which would also align with the bull pennant formation shown on the weekly chart below.
USD/CAD Weekly Chart
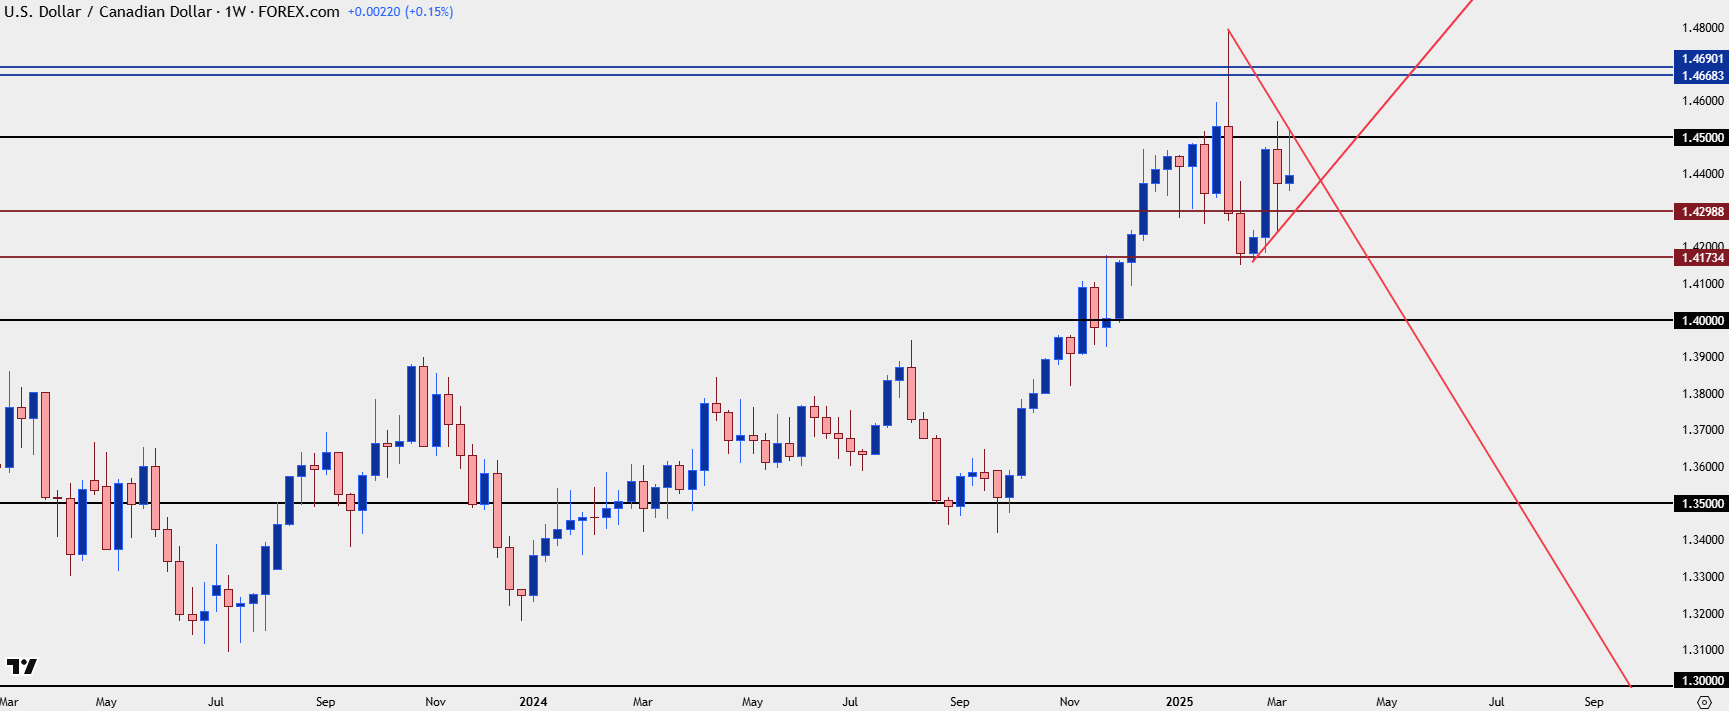
Chart prepared by James Stanley; data derived from Tradingview
USD/CAD: The Driver
At this point there’s a lot of remaining unknowns around the Trump tariffs on Canada, least of which is related impact. I’m going to try to parse through that below but there are a lot of ‘what ifs’ and ‘maybes’ to consider.
So far, the premise of tariffs have had a negative effect on the CAD and a positive impact on the USD, and rationally that makes sense as tariffs in the US could possibly bring higher levels of inflation which could demand ‘less-dovish’ monetary policy from the Fed; but there’s also the impact to Canada which heavily relies on exporting to their southern neighbor and that economic weakness could bring with it the need for even softer monetary policy, such as we’ve seen of late.
Going back to last year it seemed as though the Bank of Canada was expecting that rate cuts were finished in the near-term. That hasn’t been the case, as this week saw yet another move of moderation from the BoC, and the Bank even said that the economy faces a ‘new crisis.’
There’s also been the prior comment from Canadian officials suggesting that a trade war would bring along ‘pandemic like stimulus’ for the economy, which logically would be funded by debt which would generally be thought of as another driver of CAD-weakness.
On the other side of the argument, too much CAD-weakness could eventually bring higher levels of inflation that the Bank of Canada would need to address, particularly if growth is slowing on the back of tariffs. And as we’ve seen in U.S. equity markets this month, the tariff topic hasn’t seemed to be warmly received as risk assets have sold off aggressively. To date, Trump has delayed tariff implementation multiple times but even with an open door to push back to later in the year, he’s continued to dangle the topic in front of American equity markets even as stocks have sold off.
He had previously linked tariffs to shoring up the border, which would seem a simpler point for Canadian officials to address; but there’s also been opacity around reciprocity of tariffs that Canada imposes on American goods which would seem a subject more suited for longer-term negotiation, rather than just a month-long delay.
So, it would seem that there would be an open door for bears, as well, if the chips fall a certain way. But this would probably need some help from the executive branch of the U.S. government with some tamping down in tariff talks. To date, that hasn’t happened and that would seem to support the bullish scenario investigated above. But given change in Canadian leadership, there would be perhaps an increased possibility given the prior tension between Justin Trudeau and President Trump.
The price level that I think would signal continuation in the longer-term mean reversion scenario would be the 1.4000 psychological level. If sellers can sink the pair through that price, then longer-term charts will look attractive for that range to remain in-place. But, there’s a lot of tape until the end of March, and until then, 1.4299 presents support potential, along with 1.4173 and 1.4103, both of which could set the stage for bear traps if they hold underside wicks on the daily chart.
For bulls – it’s all about 1.4500 as there’s been continued defense of the big figure so far; if buyers can break through, there isn’t much standing in the way of a test up to the 1.4700 level, with 1.4668 and 1.4690 as the prior highs in the nine-year range for the pair.
Above 1.4800 is where matters can get dicey again, as I’m suspicious of how much liquidity may be up there, but if we do see that bullish breakout scenario take-hold, which I would think would need to come along with some shock factor of some kind but is distinctly possible, then it’s the 1.5000 psychological level that looms large overhead and that’s where I’d expect a prolonged breakout scenario to find sellers in the pair.
USD/CAD Daily Price Chart
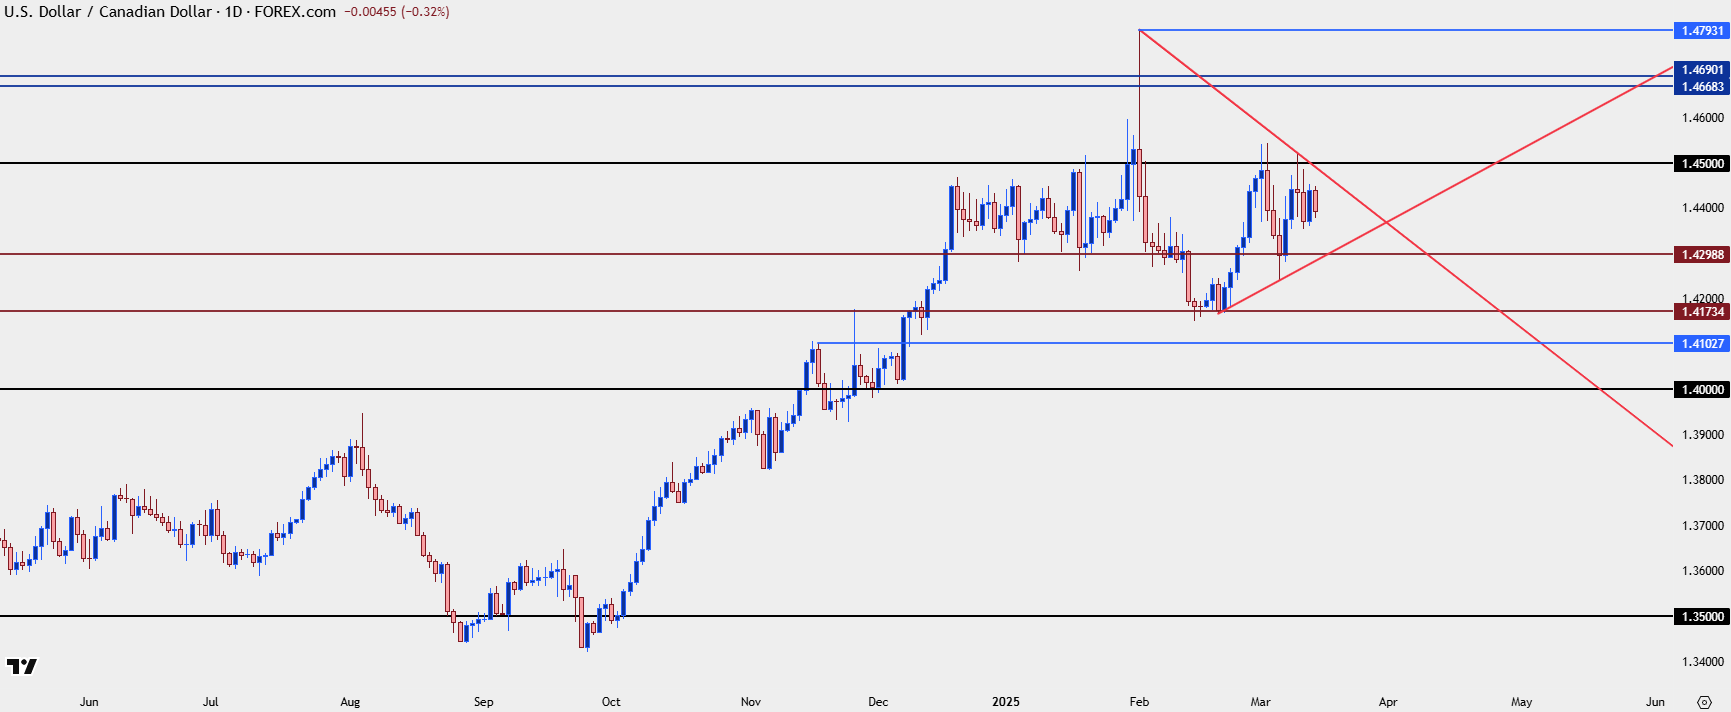
Chart prepared by James Stanley; data derived from Tradingview
--- written by James Stanley, Senior Strategist


Latest market news
Today 08:40 AM
Yesterday 10:12 PM
Yesterday 07:45 PM
Yesterday 07:26 PM
Latest articles

March 22, 2025 12:51 PM

March 20, 2025 03:55 PM

March 6, 2025 04:31 PM

February 17, 2025 08:11 AM