


Key Events This Week
- GBPUSD dropped over 120 points from the March 2025 high at 1.3014
- Nasdaq bounced more than 1,000 points from the March 2025 low at 19,115
- UK Data Watch: CPI and Annual Budget (Wednesday); Retail Sales and Final GDP (Friday)
- US Data Watch: Core PCE Inflation (Friday)
GBPUSD Outlook
UK and U.S. flash PMIs showed mixed signals on Monday, with manufacturing slipping below expansion levels and services remaining resilient above 50. However, following the Fed’s dovish—but largely priced-in—comments last Wednesday, the U.S. Dollar Index posted a daily bullish engulfing pattern, pushing GBPUSD below key support at 1.30.
This week’s CPI and Annual Budget (Wednesday), along with Retail Sales and Final GDP (Friday), are likely to influence the Bank of England’s policy outlook. For now, policy remains on hold—mirroring global central banks—as decision-makers weigh rising inflation against weakening growth, complicated by U.S. tariff quota developments.

Nasdaq Outlook
Similar to the dollar’s rebound, U.S. indices extended gains after Powell’s dovish tone, with the Nasdaq rallying over 1,000 points from its March lows, and the Dow Jones climbing over 2,000 points. Still, uncertainty lingers due to ongoing tariff adjustments and slowing economic growth, keeping the spotlight on economic data to confirm whether this rebound marks a true trend reversal—or just a pause in a broader correction.
The Fed’s preferred inflation gauge, Core PCE, is due Friday, while next week’s NFP and the upcoming 25% reciprocal tariffs in April will be critical for gauging sustained risk appetite. Technical Analysis: Quantifying Uncertainties

Technical Analysis: Quantifying Uncertainty
GBPUSD Outlook: 3-Day Time Frame – Log Scale
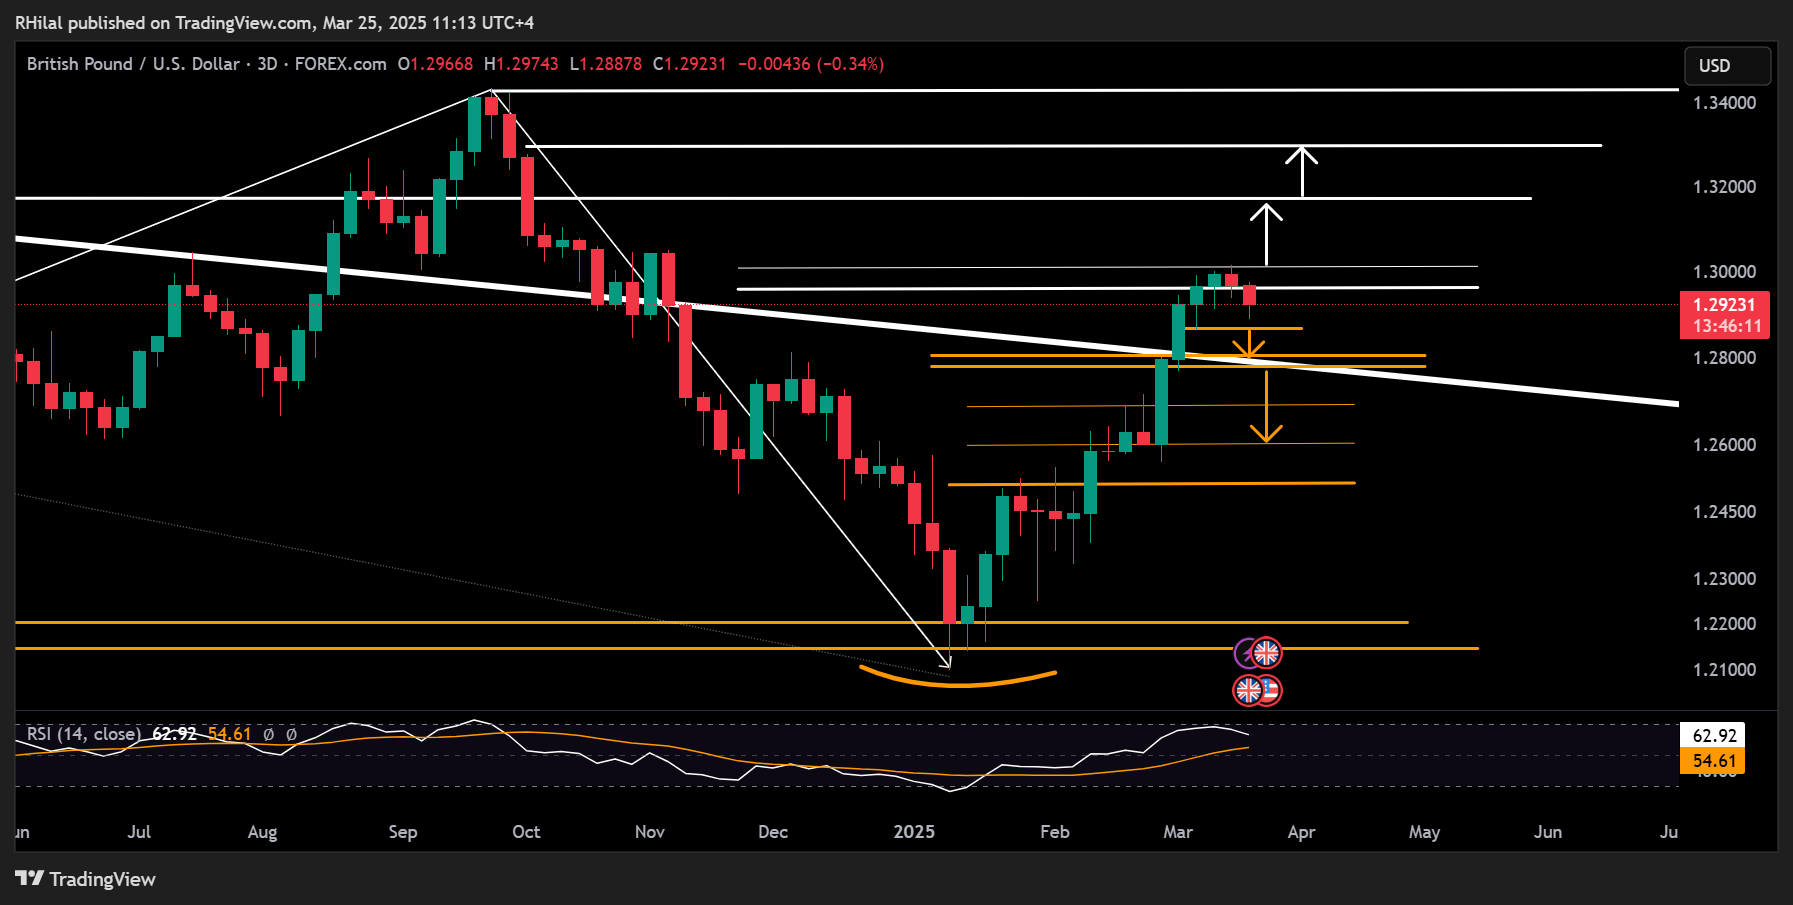
Source: Tradingview
In line with the USD Index's daily bullish engulfing candle and EURUSD’s daily bearish engulfing, GBPUSD remains below the 1.30 level, retesting support at 1.2880. The 3-day RSI has reversed from overbought territory—last seen in September 2024 when GBPUSD peaked at 1.3434.
A daily close below 1.2860 may open the door to further support at 1.2800 and 1.2780. A rebound from these levels could target a return to 1.30. However, deeper downside could follow, with targets at 1.2700 and 1.2600, if momentum fades.
Nasdaq Outlook: 3-Day Time Frame – Log Scale
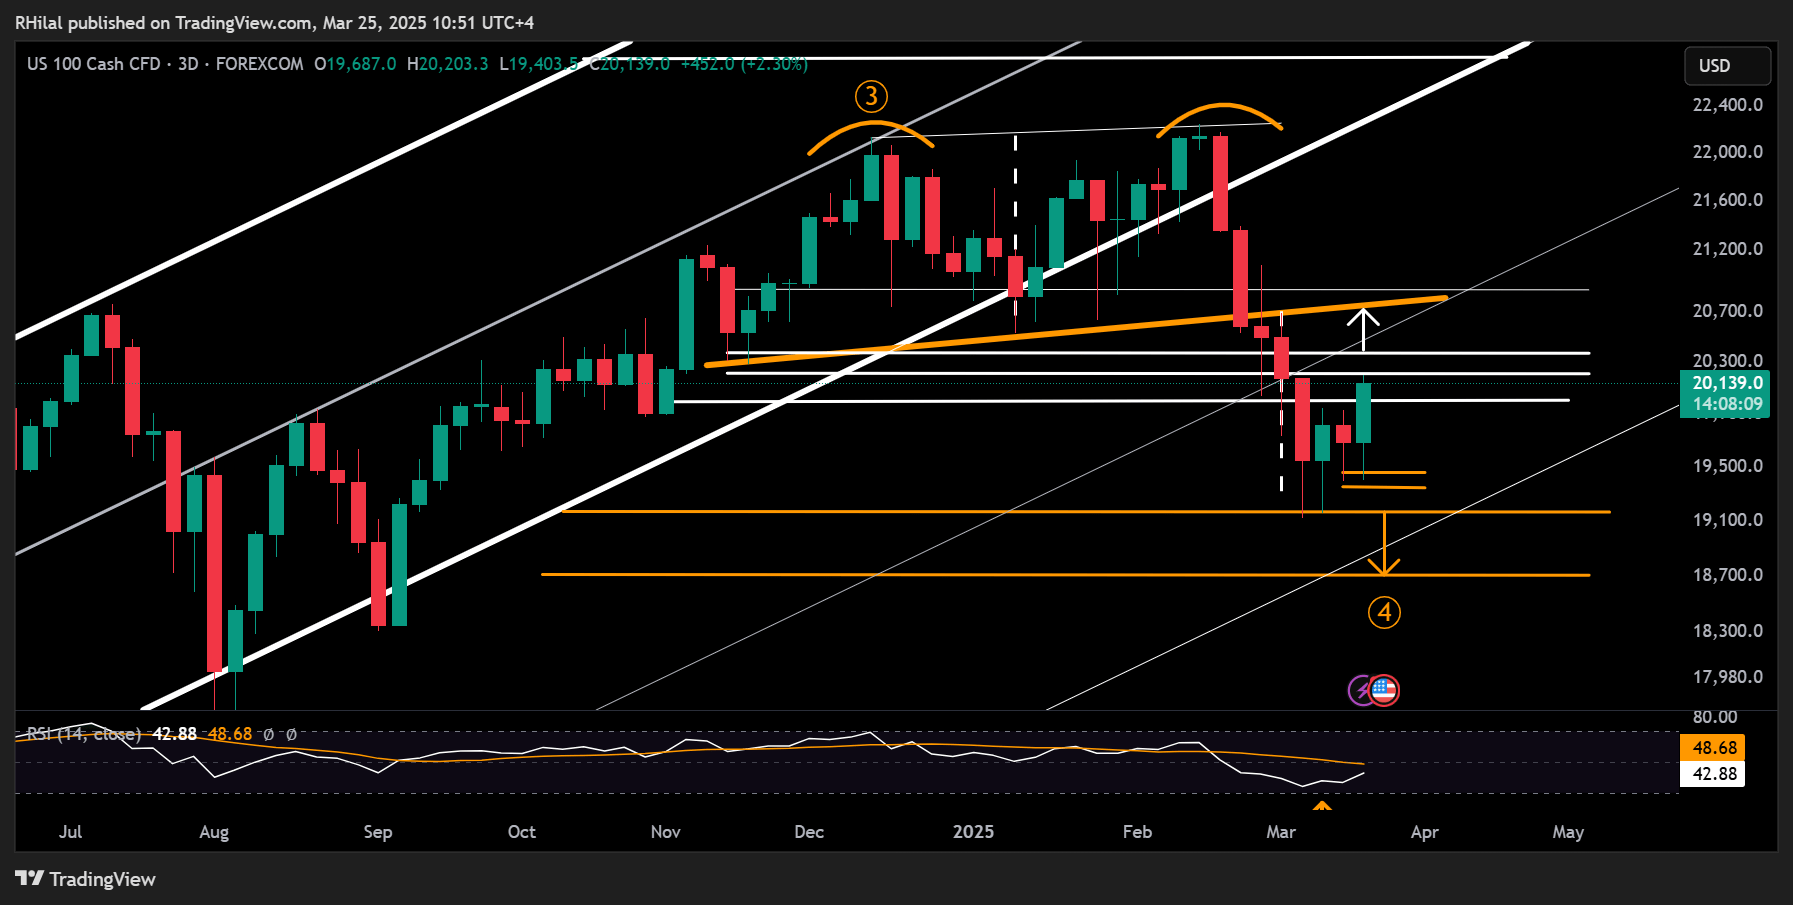
Source: Tradingview
Nasdaq’s rally stems from exhausted weekly momentum, last seen in 2022, and a key confluence zone—the 0.618 Fibonacci retracement of the August–January uptrend and the double top target. After reclaiming the 20,000-mark, the index tested 22,200, aligning with the 0.236 Fibonacci extension from the August 2024, January 2025, and March 2025 price swings.
A strong hold above 22,200 could push the Nasdaq toward 22,380 and 22,800—a major neckline where the bull run could either continue or face another correction. From the downside, a break below 19,900 may lead to a retracement toward 19,400, 19,300, and the key low at 19,100. A deeper dip could revisit 18,300—or, alternatively, spark a fresh bullish rebound.
Written by Razan Hilal, CMT
Follow on X: @Rh_waves


Latest market news
Today 08:40 AM
Yesterday 10:12 PM
Yesterday 07:45 PM
Yesterday 07:26 PM
Latest articles

March 5, 2025 09:00 AM

February 18, 2025 07:23 PM

January 20, 2025 08:17 AM

January 14, 2025 05:30 PM