


Key Events
- GBPUSD Retests 17-Year Resistance
- Nasdaq Tests Key 20,000 Support Level
- US-Canada-Mexico Tariffs May Be Withdrawn if Deals Are Finalized
- US Non-Farm Payroll Risks Add to Market Uncertainties
Although trade wars and tariffs have dominated headlines since the beginning of the year, their actual implementation has weighed heavily on the U.S. markets, the dollar, and global inflation concerns. With tariff retaliation against agricultural products between the world’s biggest economies, inflation concerns are expected to further dampen consumer confidence. This pressure has provided relief to the global currency market while U.S. indices and the DXY test key support levels.


Technical Analysis: Quantifying Uncertainties
GBPUSD Outlook: Monthly Time Frame – Log Scale
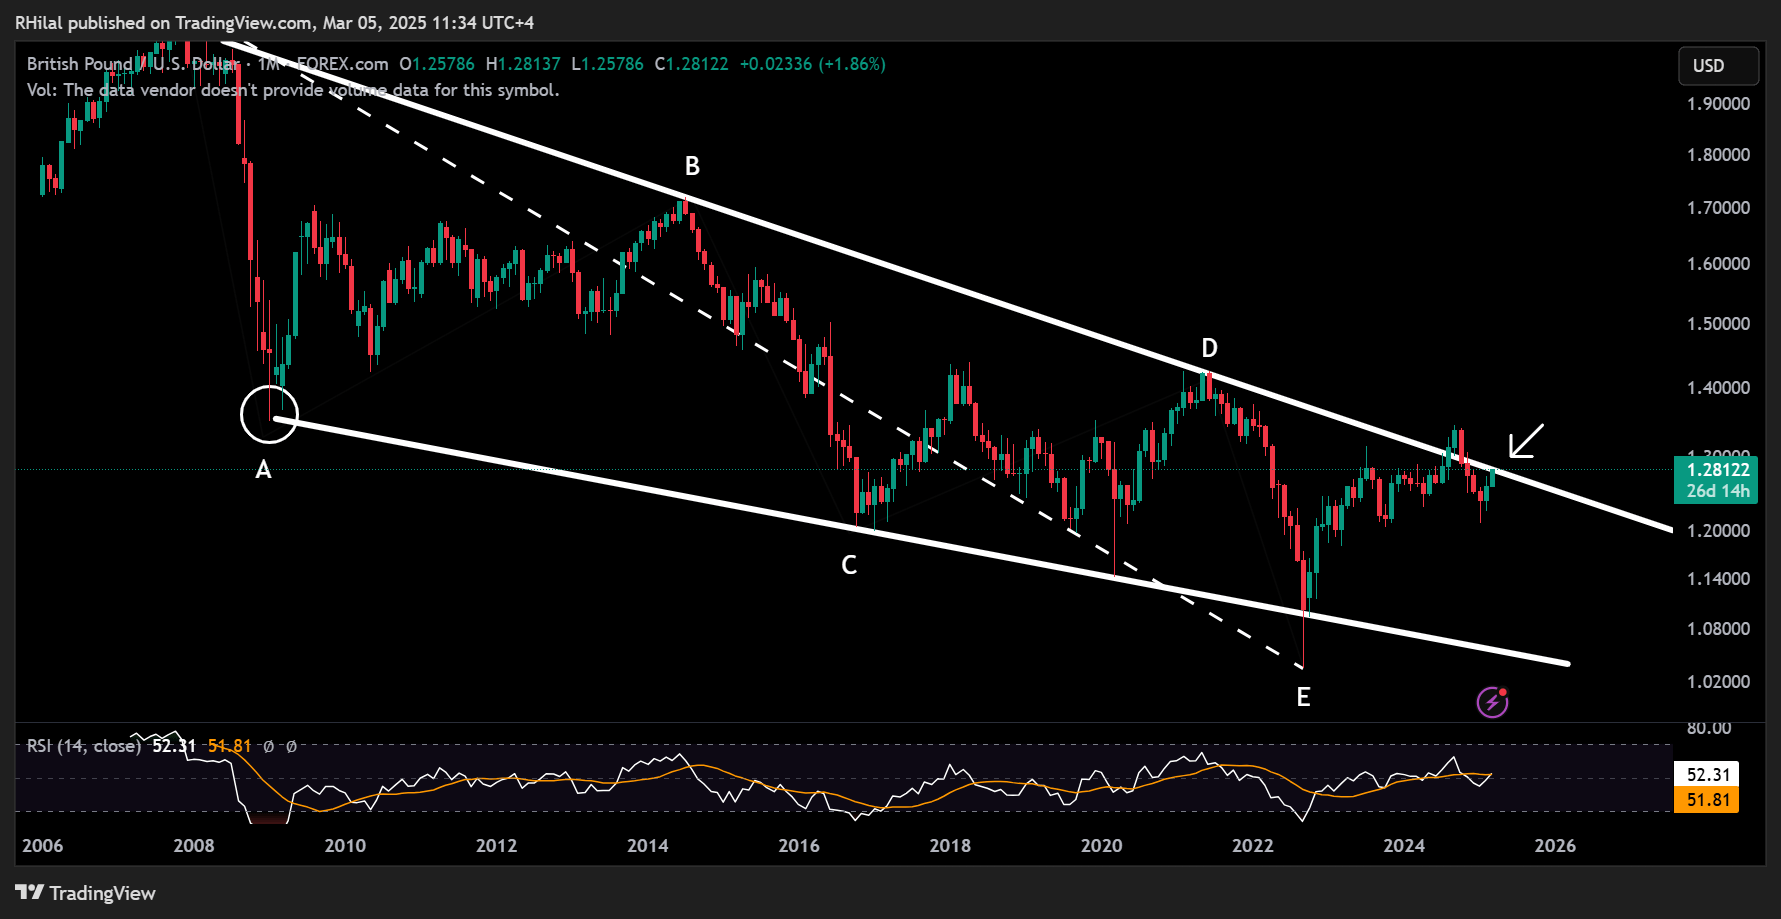
Source: Tradingview
Amid dollar weakness, GBPUSD has climbed back to a 17-year resistance level that has defined the pound’s price action since 2008. The strength of this resistance raises questions about whether the pair will experience a reversal back into consolidation or break higher toward 2024 highs. The next chart defines key support and resistance levels to watch.
GBPUSD Outlook: Daily Time Frame – Log Scale
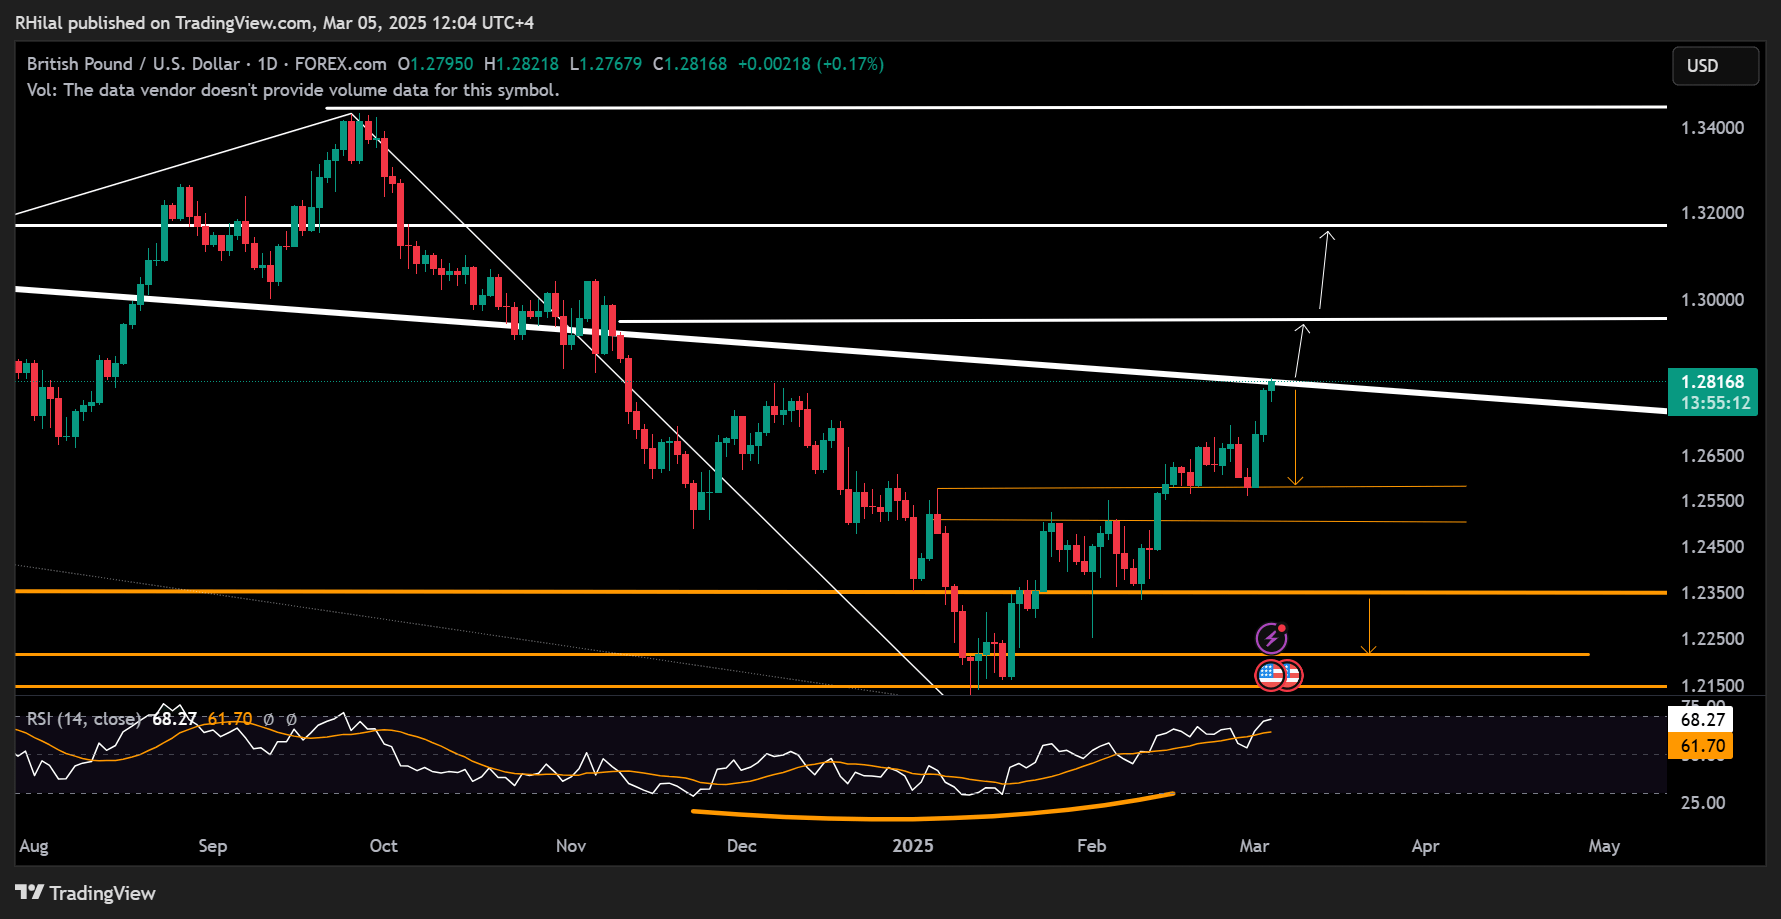
Source: Tradingview
A closer examination of key levels shows GBPUSD currently aligning with the 50% Fibonacci retracement level of the downtrend between the September 2024 high (1.3434) and the January 2025 low (1.2099) at the 1.2820 level. A confirmed close above 1.2820 could extend the rally toward the 0.618 Fibonacci level at 1.3170. A subsequent break could see the pair retest 2024 highs at 1.3434. On the downside, failure to hold above 1.2820 may reverse the trend toward support levels at 1.2700, 1.2580, and 1.2500, respectively.
Nasdaq Outlook: 3-Day Time Frame – Log Scale
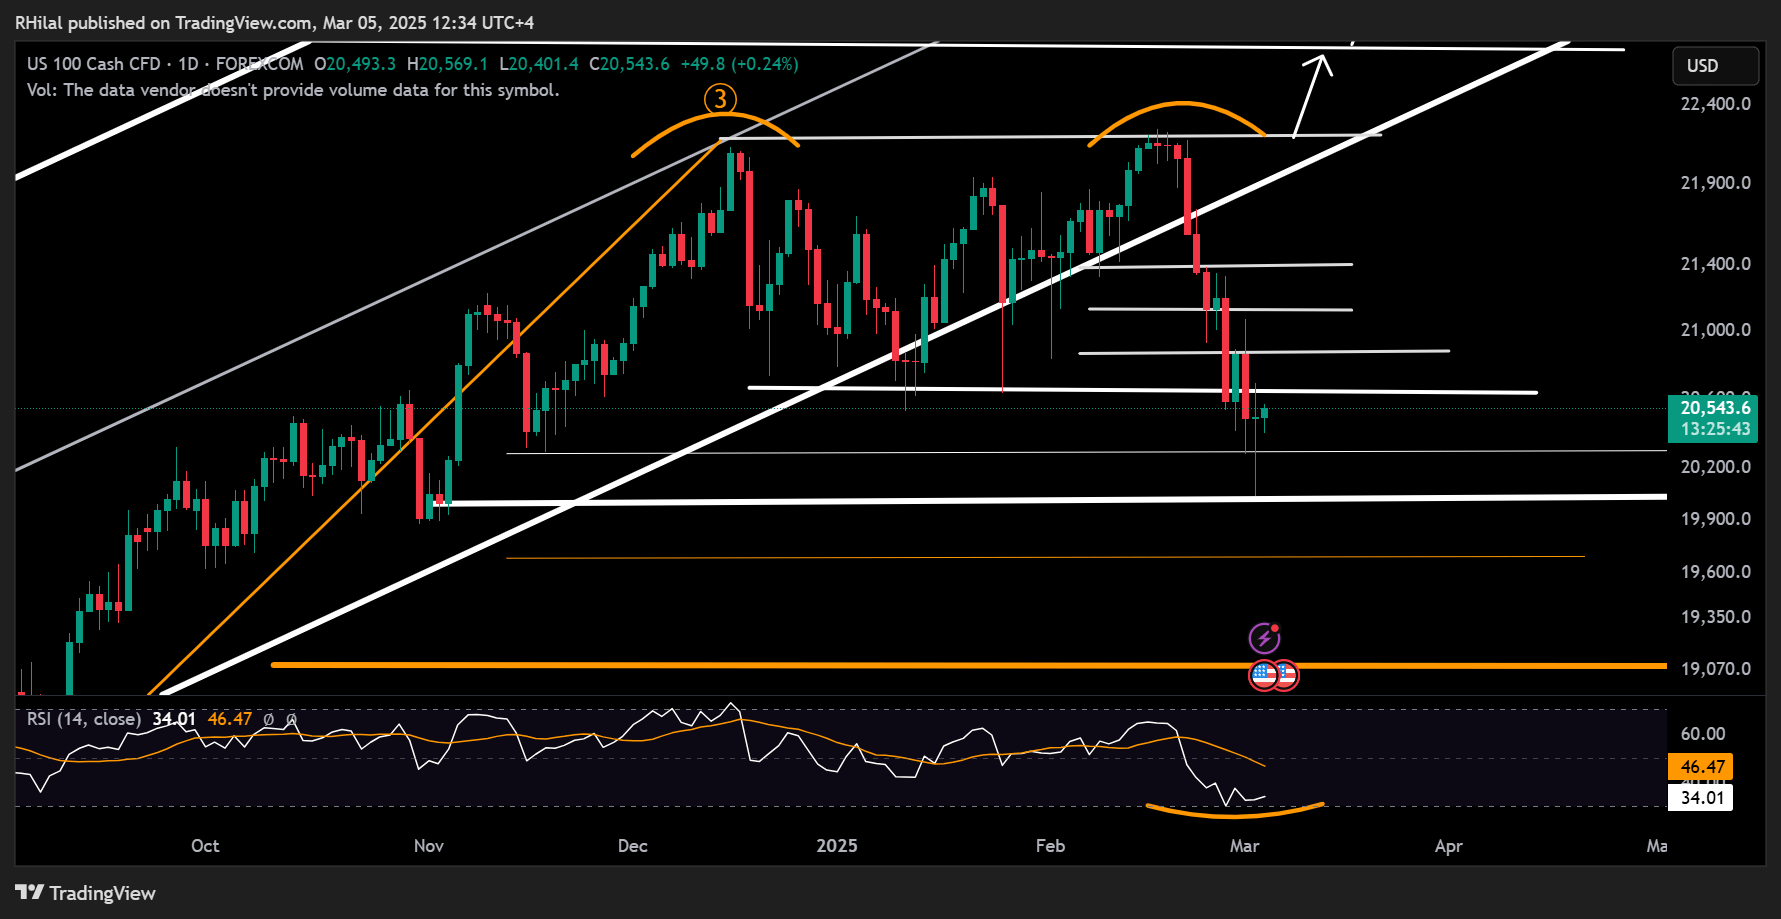
Source: Tradingview
Nasdaq’s decline tested the psychological 20,000 support level, forming another bullish wick, indicating that the lows were not sustained and reviving bullish sentiment. The next resistance levels following this rebound align with Fibonacci retracement ratios of the downtrend from the 22,200 high to the 20,000 low, specifically at 20,640, 20,880, and 21,100.
A sustained move above 21,000 could pave the way for a potential return to record highs. However, a decisive close below 19,900 could accelerate losses toward the 19,000 level.
Market confidence remains fragile due to the lingering consequences of trade wars. If key trade agreements are successfully negotiated, markets may regain their bullish trajectory unless inflation concerns reemerge, triggering unfavorable monetary policies.
Written by Razan Hilal, CMT
Follow on X: @Rh_waves


Latest market news
Today 08:40 AM
Yesterday 10:12 PM
Yesterday 07:45 PM
Yesterday 07:26 PM
Latest articles

Today 08:40 AM


March 30, 2025 06:00 AM

March 29, 2025 02:00 AM