


After easing a little at the end of last week, gold prices bounced back in the first half of Monday’s session as the US dollar weakened against a basket of foreign currencies. The recovery comes after gold’s spectacular run saw it smash through records to cross the $3,000 milestone last week. The metal has been driven by strong safe-haven demand and relentless central bank buying. But moving forward, the gold forecast may not be as strong as the first months of the year. We think that the pace of the buying could at least slow, if not reverse.
Gold forecast: Reasons why demand could potentially weaken
Gold is looking quite stretched, and a long-overdue cooling-off period may be due anyway. We will discuss technical factors shortly, but fundamentally, the metal could weaken, for example, if geopolitical risks fade and supply ramps up. Trump’s pledge to resolve conflicts in Ukraine and Gaza might dampen the haven bid, while elevated prices could entice miners to increase output. And the potential for reduced central bank demand (because of elevated prices) could further temper gold’s upward momentum. It is also worth keeping an eye on the US equity markets which have started to show signs of a potential bottom after a turbulent period. The performance of equities could impact gold’s path. If stock market volatility stays elevated, investors are likely to continue favouring gold amid haven demand. Conversely, should Trump soften his trade stance to support equities, a stock rally could trigger profit-taking in gold as risk appetite returns.
Some of these factors could still take time to play out and may not be an immediate risk to the gold forecast, but it is something to have in the back of your minds as prices do not always go in one direction – even if, like me, you have a bullish bias towards gold.
Core PCE price index is this week’s key US data
In the immediate term, gold’s direction this week could depend on the dollar, at least to some degree. We have the S&P flash services and manufacturing PMIs to come later on, but they are unlikely to be a game changer in as far as setting the tone for the dollar this week. But we do have a key measure of inflation coming up, which could.
Both CPI and RPI measures of inflation earlier this month came in softer than forecast, though the University of Michigan’s survey told a more unsettling story, with inflation expectations rising at an uncomfortable clip. Now, the focus shifts to the Fed’s preferred inflation measure – the core PCE Price Index, due Friday. Last week, Jerome Powell sought to steady the ship, reiterating that long-term inflation expectations are anchored and that tariff-related price pressures may prove fleeting. Still, with the weaker CPI print largely confined to the services sector, markets aren’t convinced this will necessarily translate into a softer PCE reading. A further +0.3% month-on-month gain is what traders are eyeing.

Technical gold forecast: Trade ideas
The trend is still clearly bullish on gold and dip-buying remains my preferred trading strategy in this market. Are we now going to get a dip once more, with prices looking over-extended? Well, the daily RSI indicator has been in a state of negative divergence with prices, unable to make a new higher high despite the underlying gold prices making new records last week. The negative divergence may be a sign that the momentum is weakening, albeit no major support has broken down yet.
Prices found a bit of resistance towards the end of last week at these overbought levels when they tested the Fibonacci extension zone shown on the chart, between around $3032 to $3043. Here, the 161.8% Fib extension of the mini drop in the last week of February meets the 200% extension of the more significant swing we saw between October and November. The coming together of these levels make it an objective area for some traders to book profit around, although that is not to say that prices will necessarily top here. Indeed, I am merely looking for a short-term dip to form (which may already have ended on Friday).
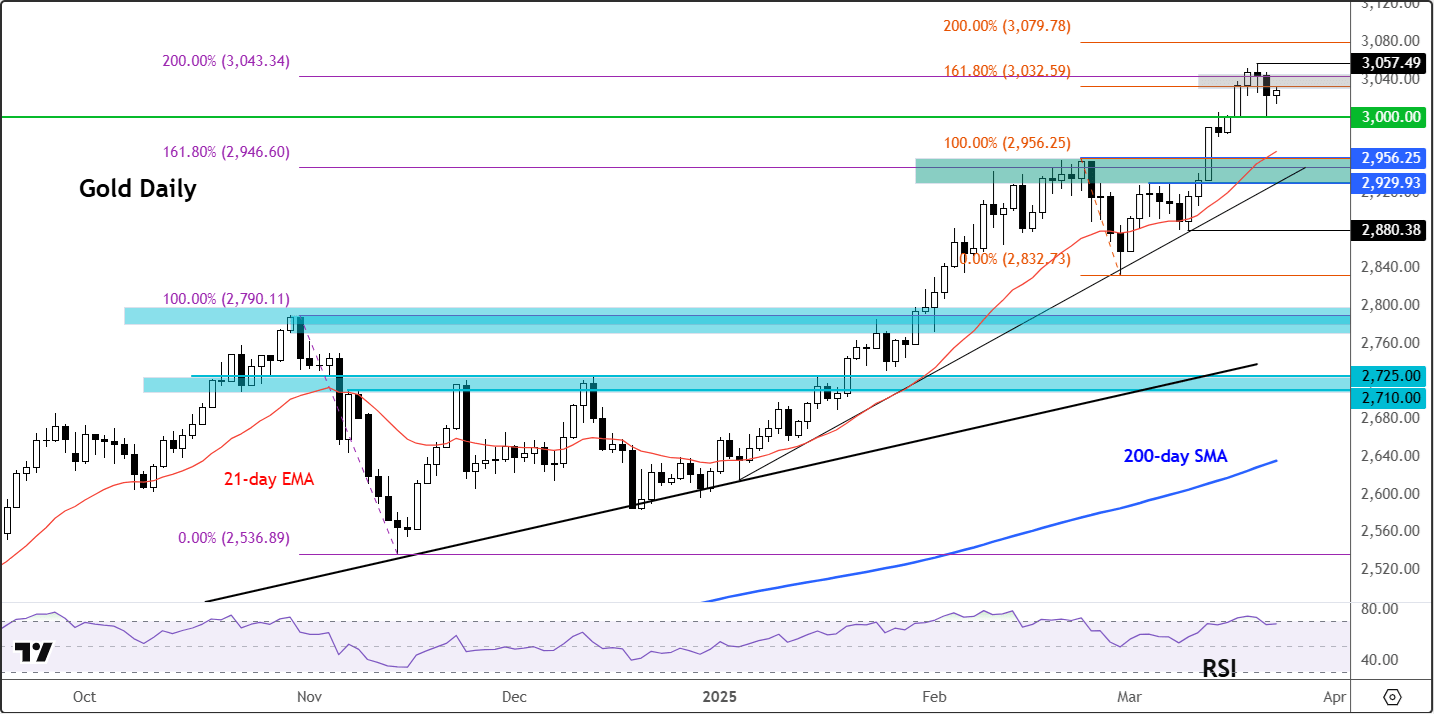
Source: TradingView.com
Anyway, while a new record high of $3057 was made above that Fibonacci area, gold ended Friday’s session below those Fibonacci extension levels to suggest that the short-term trend on the gold chart had stopped being decisively bullish. Clearly, profit-taking was at least partly the reason for the slight weakness we saw at the back of last week.
Support levels to watch
Crucially, the $3000 level turned into support on the first test of this level from above, on Friday. The fact that this level held suggests the bulls remain in control of price action. However, if we now see gold dip back below this $3000 level later this week, then that could trigger some liquidations of long positions. The next support below $3000 comes in around $2930-$2956 range. This was the last major resistance area prior to gold breaking out above $3K. We also have the 21-day exponential average and trend line coming into play around that zone, making that zone key.
Some thoughts on gold’s long-term overbought conditions
Gold’s incredible strength has made the long-term charts of gold flash big overbought signals, so a cooling-off period is long overdue.
The monthly Relative Strength Index (RSI) has remained above 70.0 since April 2024 and recently revisited 80.0—levels that have historically preceded pullbacks. The last time RSI was this high in October, gold corrected for two months. Similar signals were seen at peaks during the pandemic and 2011. The weekly RSI is also elevated at 75.0.
While this doesn’t necessarily mean an immediate reversal, some consolidation or a minor correction looks likely – especially with the daily RSI also now back at 70.00 and prices testing a Fibonacci extension zone around $3032-$3043 zone.
-- Written by Fawad Razaqzada, Market Analyst
Follow Fawad on Twitter @Trader_F_R


Latest market news
March 26, 2025 09:18 AM
March 26, 2025 08:56 AM
March 26, 2025 04:01 AM
March 26, 2025 12:40 AM
March 25, 2025 08:49 PM
March 25, 2025 07:05 PM
Latest articles

March 25, 2025 07:05 PM

March 25, 2025 05:31 PM

March 25, 2025 12:57 AM

March 24, 2025 05:28 AM