


USD/JPY, USD, EUR/USD Talking Points:
- USD/JPY has continued to rally and is now trading at a fresh three-week-high.
- The Fibonacci resistance looked at earlier in the week has now been traded through following a pullback which buyers defended the 150.00 level.
- In the below video I look at the USD into tomorrow’s Core PCE announcement, and USD/JPY could be a compelling option for USD-strength scenarios. And as looked at earlier in the week, GBP/JPY could similarly be of attraction for those looking for Yen-weakness.
The USD/JPY rally continues to churn higher and today sees the pair trading at a fresh high even despite a pullback in DXY. That illustrates Yen-weakness that’s outstripped the USD-weakness showing elsewhere and as I had looked at on Monday, GBP/JPY continues to shine as the pair has forced a strong breakout to step up to a fresh two-month-high.
In USD/JPY, the pair appears to be positioned well for bullish continuation in scenarios of USD-strength, and given tomorrow’s Us Core PCE event, there could be an open window for such a scenario. USD/JPY is fast approaching the next resistance level looked at in this week’s webinar at 151.51, which is now nearing confluence with the 200-day moving average.
On a shorter-term basis, 150.77 is now higher-low support potential and the 150.00 level has so far been well defended by bulls in the recent rally.

USD/JPY Daily Price Chart
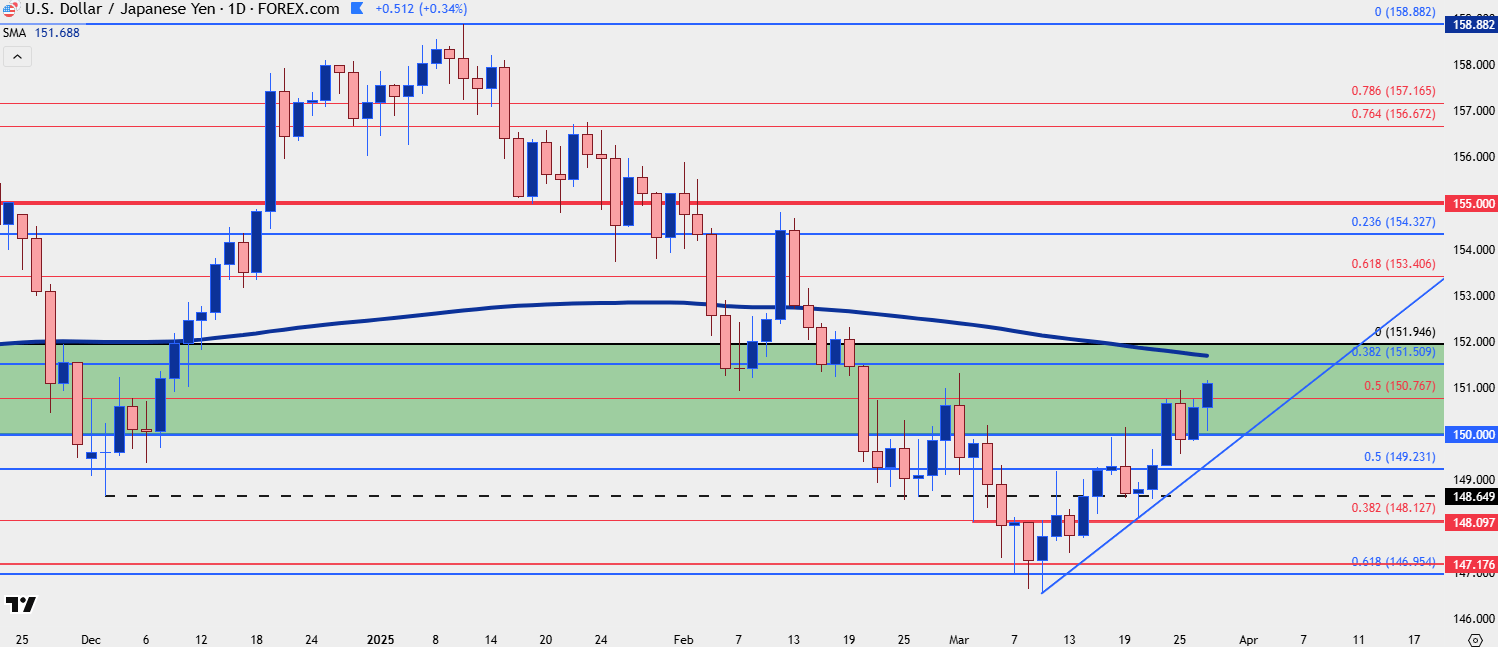 Chart prepared by James Stanley; data derived from Tradingview
For the USD, price has so far shied away from a resistance test at a key area on the chart, plotted from around the 105.00 level spanned down to the 200-day moving average. But, since the FOMC rate decision bulls have been making a push-higher, with both higher-highs and higher-lows printing on the chart.
I looked into that turn potential in the Tuesday webinar before the Fed announcement, and the RSI divergence that highlighted that potential for change has now rectified. EUR/USD has played a role in this, of course, as that pair ran into a brick wall of resistance at a key Fibonacci level.
In the USD, 103.98 remains a key spot for bulls to defend, with 103.74 below that as deeper support. For resistance, it’s all about the 200-dma sitting overhead that’s confluent with the 105.00 level that’s both a psychological level and a Fibonacci level.
U.S. Dollar Four-Hour Chart
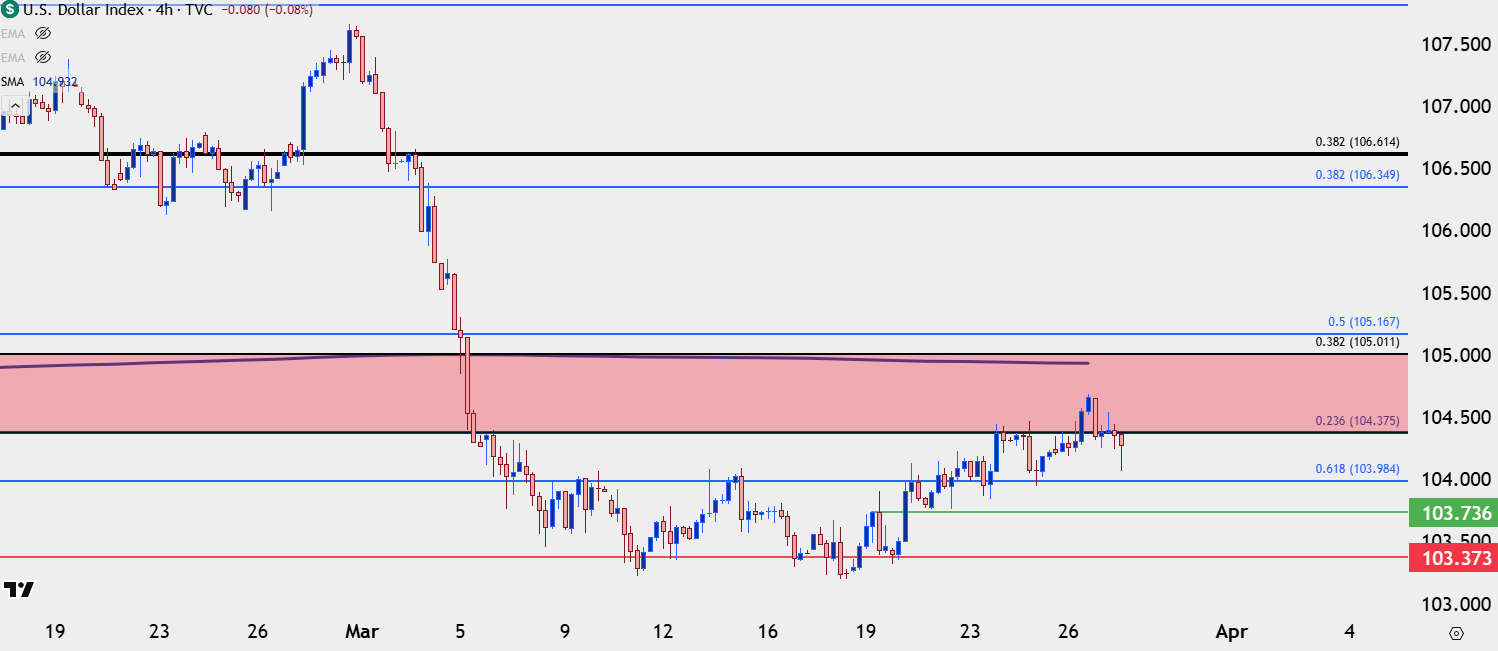 Chart prepared by James Stanley; data derived from Tradingview
EUR/USD
The Euro makes up 57.6% of the DXY quote and of late, there’s been that mirror image type of dynamic. While that can diverge, it also highlights a couple of different interesting themes as it was the support at the 200-day moving average that’s so far helped EUR/USD to bounce.
That bounce has been shallow, though, running a little more than 50 pips, and the 1.0800 level is coming in as resistance. For structure, there’s price action swings at 1.0826 and 1.0865 above that round level. For support, if sellers can elicit a breach below the 1.0730 level that marks the bottom of the current support zone, the next major level is the 1.0611 Fibonacci level that hasn’t been in-play since early-March. That scenario would seem to need a breakout test from DXY bulls at the 105.00 handle but with a key piece of inflation data on the docket for tomorrow, that would be a scenario of interest for continuation in both trends.

EUR/USD Four-Hour Price Chart
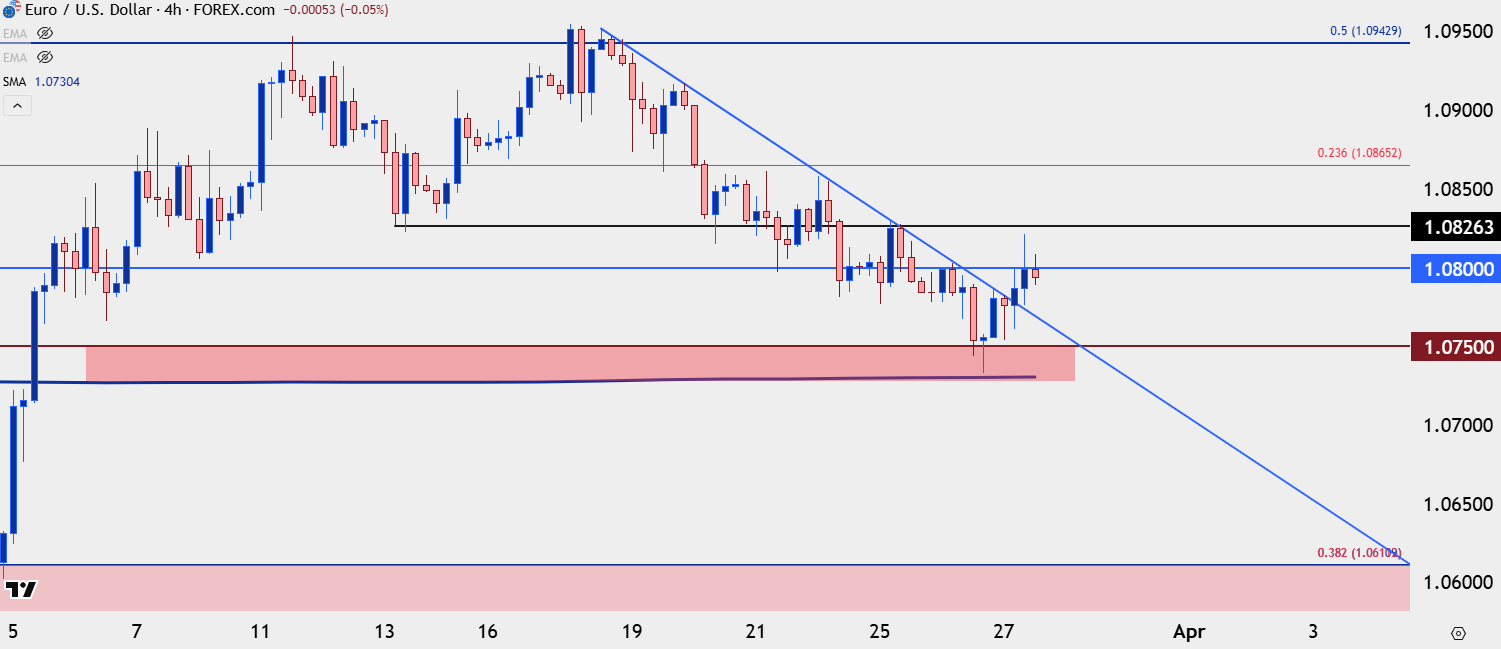 Chart prepared by James Stanley; data derived from Tradingview
--- written by James Stanley, Senior Strategist


Latest market news
Today 11:30 AM
Today 08:40 AM
Yesterday 10:12 PM
Latest articles

Yesterday 06:52 PM

Yesterday 04:11 PM

March 29, 2025 11:00 PM

March 28, 2025 03:32 PM