

GBP/USD Talking Points:
- While EUR/USD has continued to struggle around the 1.0500 area, the bullish trend in Cable (GBP/USD) has been clearer, with the pair setting a fresh two-month-high last week.
- Last week’s USD rally drove pullbacks in many majors, GBP/USD included, but the pair held support at a key Fibonacci level, and an area of prior resistance, to keep the door open for fresh highs.
- I look at GBP/USD along with other major FX pairs each week in the Tuesday webinar. Click here for registration information.

GBP/USD is off to a fast start to the week, challenging the two-month-high that was set last Wednesday after the first test above 1.2700 in 2025 trade. USD-strength returned on Thursday and Friday, and this showed in most major pairs, but in GBP/USD, price found support at a Fibonacci level of note, plotted at 1.2571 and this is confluent with a prior swing-high from the opening days of the New Year.
As I’ve been discussing in webinars of late, GBP/USD could remain as a preferable major pair for scenarios of USD-weakness, especially against EUR/USD which has continued to hold resistance at the same level that marked the highs back in January.
For next resistance in GBP/USD, the 50% mark of the same Fibonacci retracement that helped to set support at the 61.8% plots just overhead, at 1.2736. Just above that at 1.2758 is another Fibonacci level of note, as the 61.8% retracement of the 2021-2022 major move provides a bit of confluence; and above that is the 200-day moving average, currently plotted at 1.2788.
GBP/USD Daily Chart
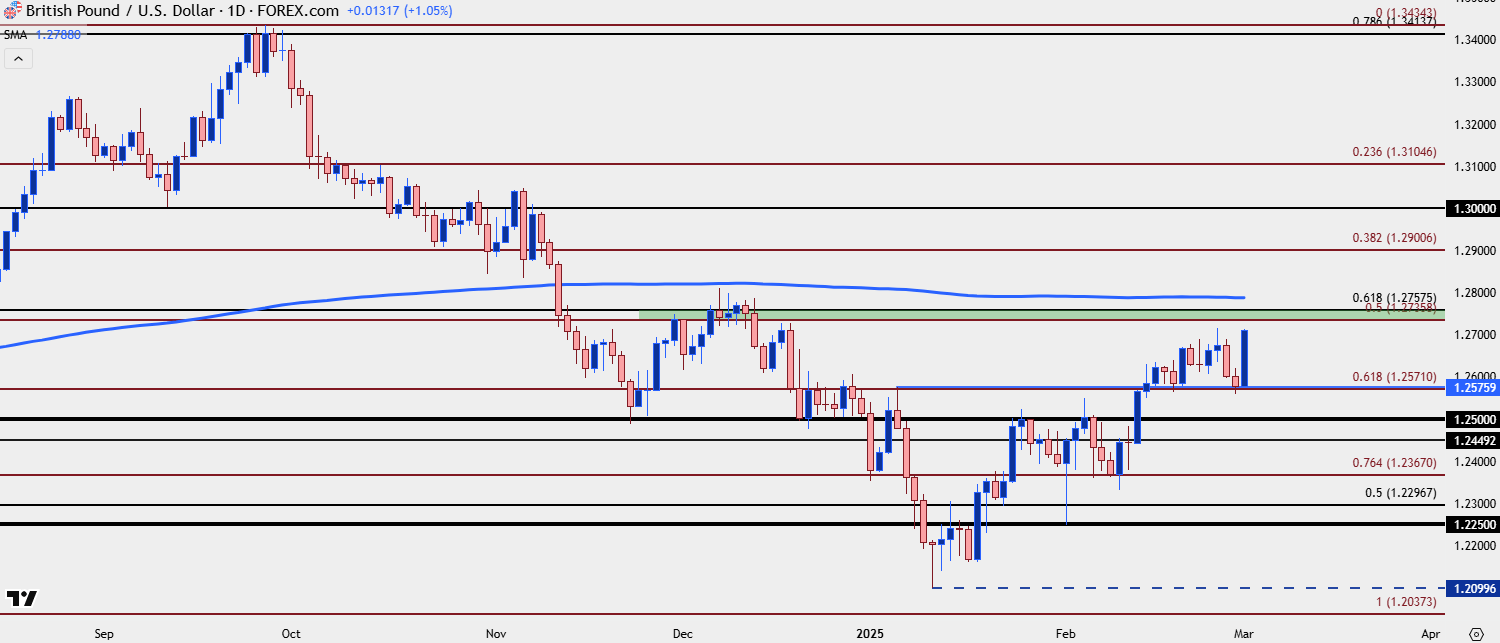 Chart prepared by James Stanley; data derived from Tradingview
GBP/USD Weekly
For context, it’s been a fast turn so far in 2025 and while the below chart bears resemblance to a V-shaped reversal, it also highlights the challenge of chasing a well-developed move that’s nearing a big batch of confluent resistance potential. There’s also a price of note at 1.2630, which can come into play as higher-low support for bullish continuation. This was the high three weeks ago, when bulls were finally able to prod a breakout above the 1.2500 psychological level. That was also the close for the week after and the open for last week, so there’s a bit of historical reference there, as well.
GBP/USD Weekly Chart
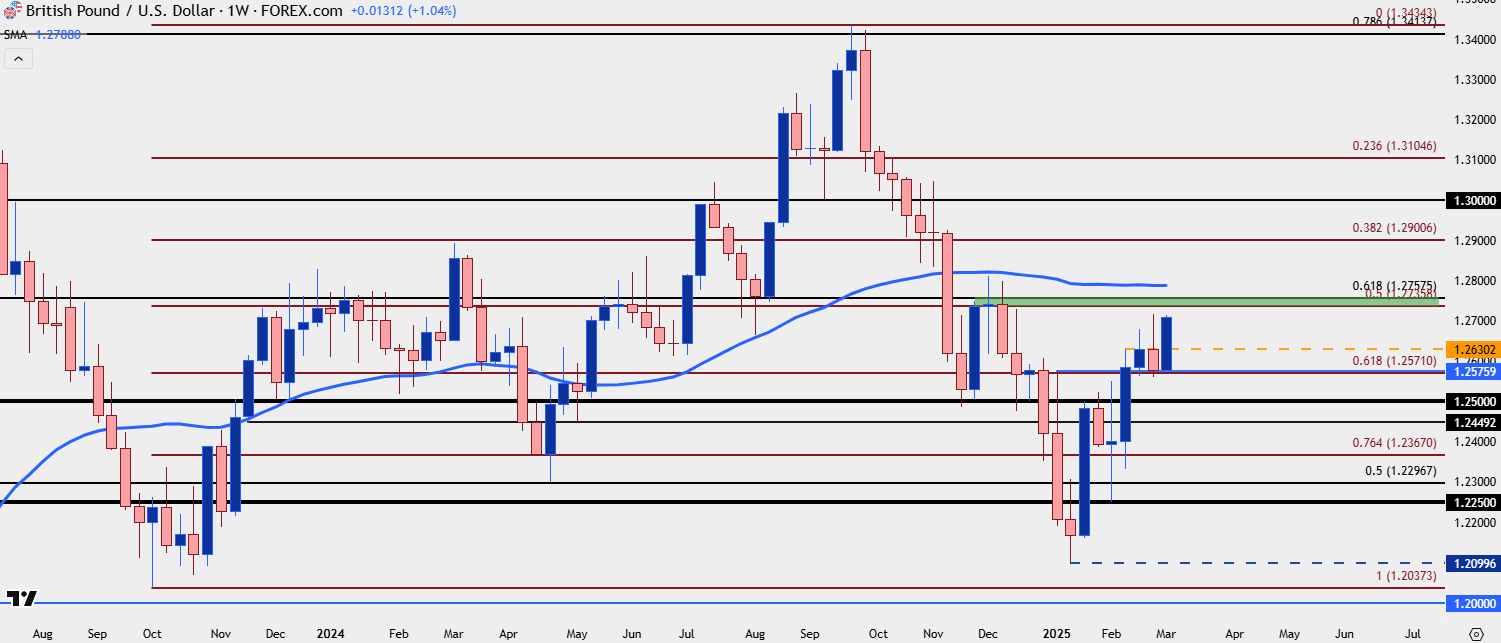 Chart prepared by James Stanley; data derived from Tradingview
--- written by James Stanley, Senior Strategist


Latest market news
Today 11:30 AM
Today 08:40 AM
Yesterday 10:12 PM
Latest articles

Yesterday 07:45 PM

Yesterday 07:26 PM

March 26, 2025 04:13 PM

March 26, 2025 08:56 AM