


US Dollar Key Points
- Traders are starting to price in the potential for outright contraction in the US economy.
- Meanwhile, Germany’s announcement of a €500B infrastructure and defense program is a potential game-changer for the European continent.
- The US dollar Index is also breaking back below its 200-day MA, hinting at a bearish shift in the long-term trend
It’s hard to deny the big shift we’ve seen across markets in recent weeks.
Spurred along by fears of a tariff-driven contraction in trade, investors are starting to price in the potential for outright contraction in the world’s largest economy, with traders on the prediction market Kalshi currently implying a 40% chance of a US recession this year:

Source: Kalshi
Traders have accordingly revised up their forecasts for 2025 interest rate cuts from the Federal Reserve to 3 from closer to 1 a few weeks ago.

At the same time, last week’s frosty reception during Ukrainian President Zelensky’s White House visit has seemingly reinvigorated European unity. At the risk of sounding hyperbolic, yesterday’s announcement that Germany was considering relaxing its “debt brake” to establish a €500B infrastructure and defense program over the next decade is a potential game-changing development from the traditionally tight-fisted European leader.
The combination of uncertain growth prospects in the US and the possibility of large fiscal stimulus in Europe has had a predictably bearish impact on the US Dollar Index (DXY). For those with relatively long memories, it’s notable that the greenback is tracing out a similar pattern as it did under Trump 1.0, with an initial spike fading relatively quickly:
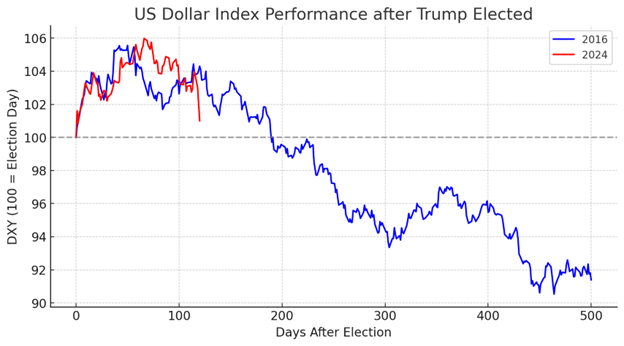
Source: TradingView, StoneX. Note past performance is not necessarily indicative of future returns.
Time will tell if this historical parallel holds over the next year+, but given the current mix of fundamental storylines, the path of least resistance for the US Dollar remains to the downside.
US Dollar Technical Analysis – DXY Daily Chart
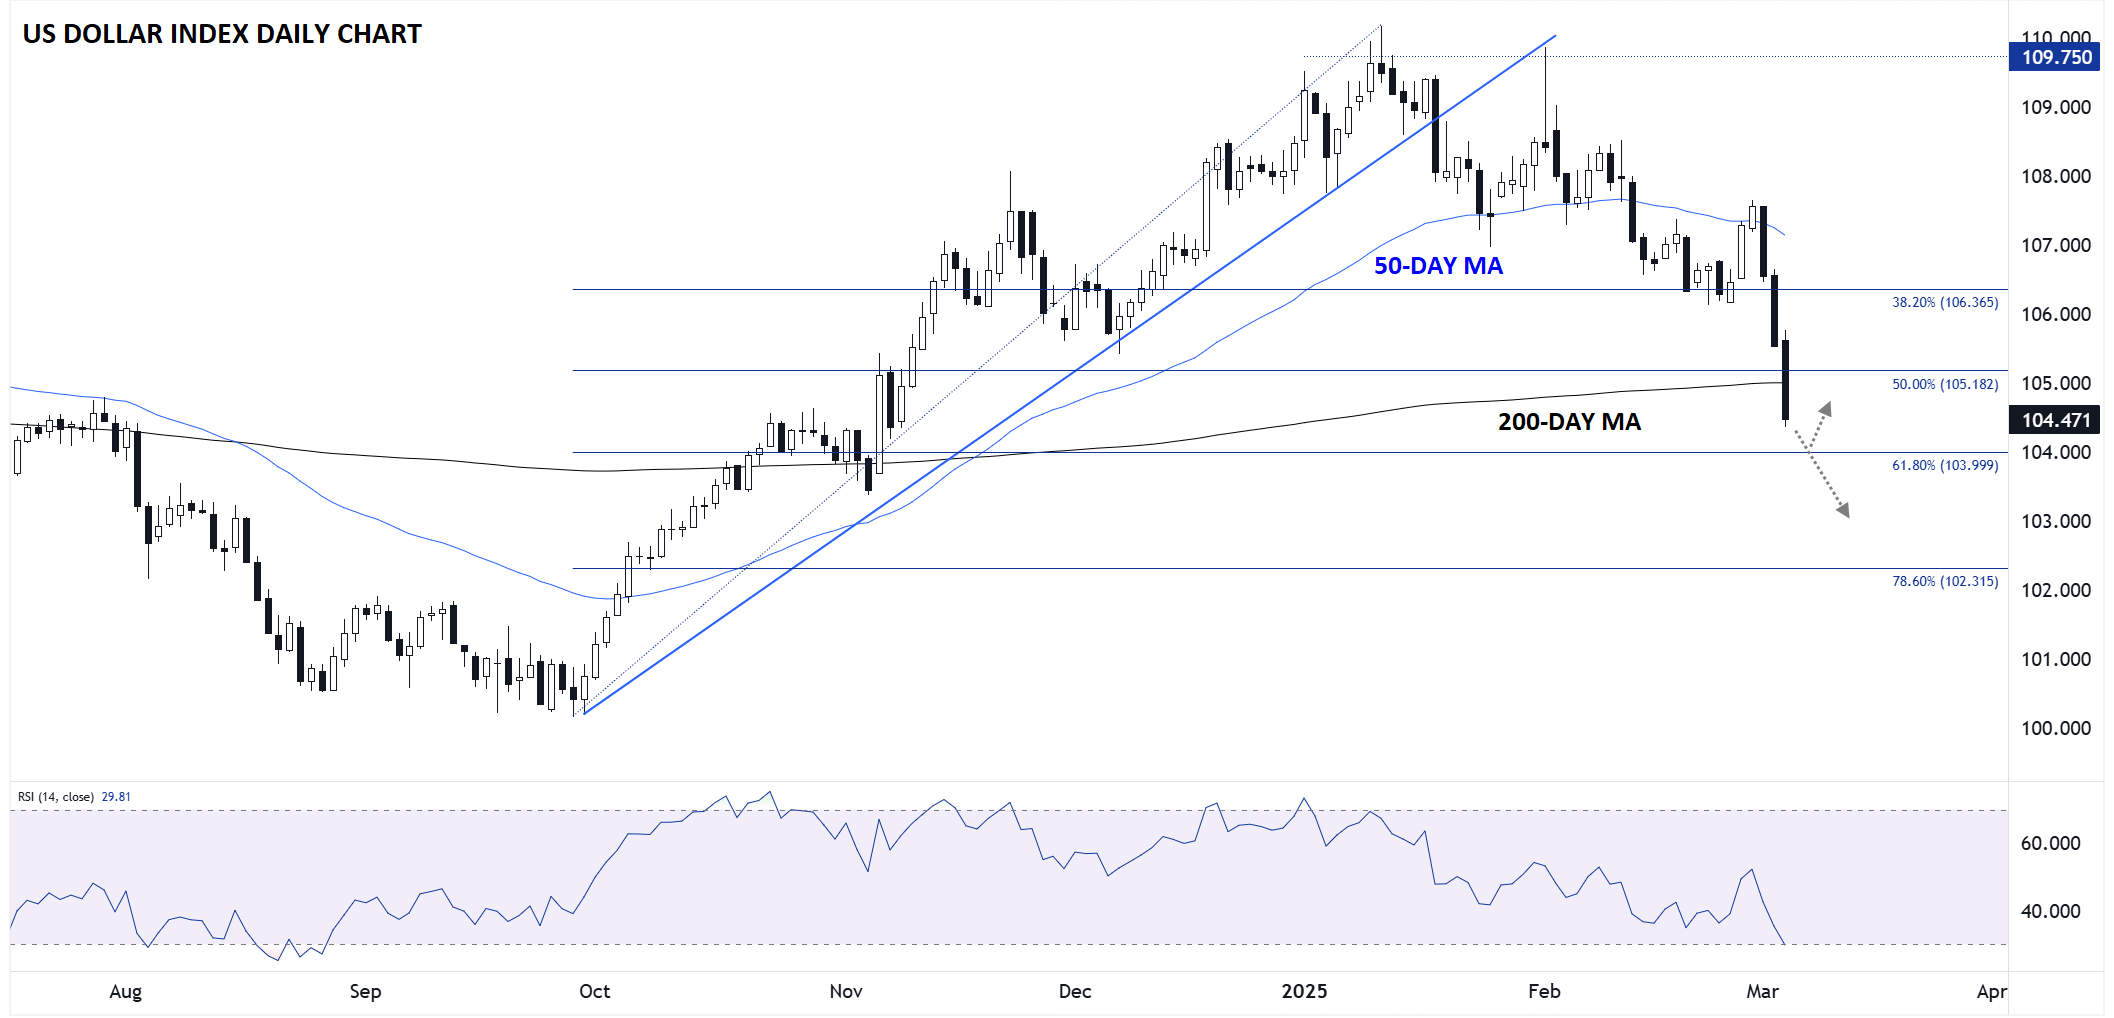
Source: StoneX, TradingView
As the chart above shows, the US Dollar Index (DXY) is off to a particularly ugly start to the week, dropping more than 300 pips from its Monday open in the mid-1.0700s to below 104.50. As we go to press, the US Dollar Index is currently seeing its worst 3-day performance (-2.9%) since late 2022!
From a technical perspective, DXY is also breaking back below its 200-day MA, hinting at a bearish shift in the long-term trend. Beat up bulls may next look to defend the 61.8% Fibonacci retracement of the October-February rally at 104.00, though if that level gives way, there’s little in the way of significant support until closer to 102.00.
As ever in the current environment, it’s crucial to remain up-to-date on the latest news to understand which way these fundamental winds are blowing.
-- Written by Matt Weller, Global Head of Research
Check out Matt’s Daily Market Update videos on YouTube and be sure to follow Matt on Twitter: @MWellerFX


Latest market news
Today 11:30 AM
Today 08:40 AM
Yesterday 10:12 PM
Yesterday 07:45 PM
Latest articles

Yesterday 06:52 PM

March 27, 2025 06:52 PM

March 22, 2025 12:51 PM

March 19, 2025 08:17 PM