


Key Events:
- Trump has threatened the Eurozone with 200% tariffs on alcoholic beverages in response to the EU's retaliatory measures against U.S. steel and aluminum tariffs, impacting American whiskey exports.
- The escalating trade war between the world's largest economies has driven gold prices close to $3,000 per ounce.
- Today’s U.S. consumer sentiment report will be closely watched for further market impact. The BOJ, FED, BOE, and SNB are set to announce policy decisions next week that could significantly influence market sentiment.

Amid fears of economic contraction, oil prices easing to three-year lows, and declining inflation rates, the Bank of Canada (BOC) proceeded with a rate cut this week, fueling expectations of further cuts by global central banks. This comes against the backdrop of an escalating tariff war, which Trump describes as “No pain, no gain,” while the rest of the world interprets it with severe economic consequences.
Market Overview
Key technical levels remain intact despite ongoing trade war turbulence
- Nasdaq reached the 19,100-support level, completing a double-top pattern and dropping to momentum levels previously seen in 2022. It managed to rebound despite headlines highlighting escalating US-Canada tariffs, along with rising tensions between the US and the EU.
- EUR/USD surged to its highest level since November 2024, touching 1.0947 before retreating more than 100 pips to 1.0822 amid exhausted momentum across currency markets.
However, the next phase of the trade war—driven by EU retaliations and further US escalations—could lead to a different market impact, potentially diverging from the previously observed trend of a weakening dollar.

Technical Analysis: Quantifying Uncertainties
EURUSD Outlook: 3-Day Time Frame – Log Scale
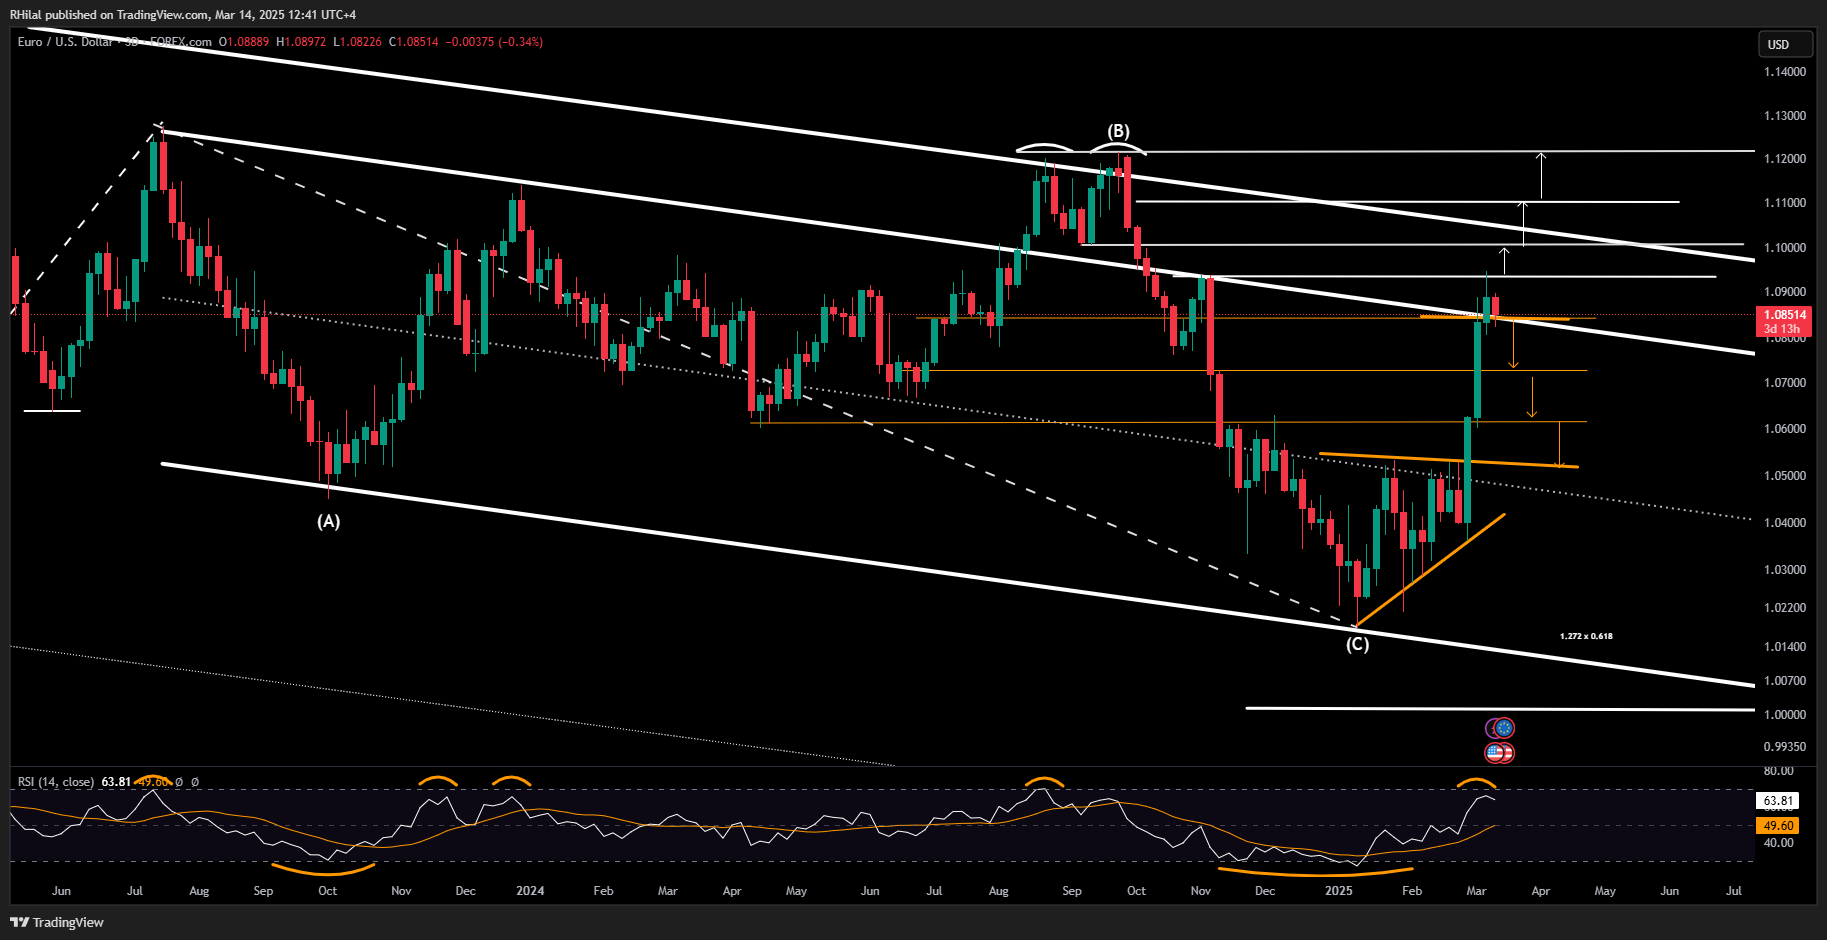
Source: Tradingview
EUR/USD remains below the 1.0947 high last seen in November 2024, aligning with the US Dollar Index’s corresponding low from the same period. However, the pair continues to hold near the 1.0850 support level and the upper boundary of the respected declining channel originating from the July 2023 highs.
This setup presents two potential scenarios:
Bearish Scenario: A sustained break below 1.0820 could extend the decline towards 1.0730, 1.0620, and 1.0530 in the coming sessions.
Bullish Scenario: A hold above 1.0850 could support a recovery towards 1.0947, where another confirmed breakout is required to project further gains toward 1.10, 1.11, and 1.1220—aligning with the September 2024 highs.
Nasdaq Outlook: 3-Day Time Frame – Log Scale
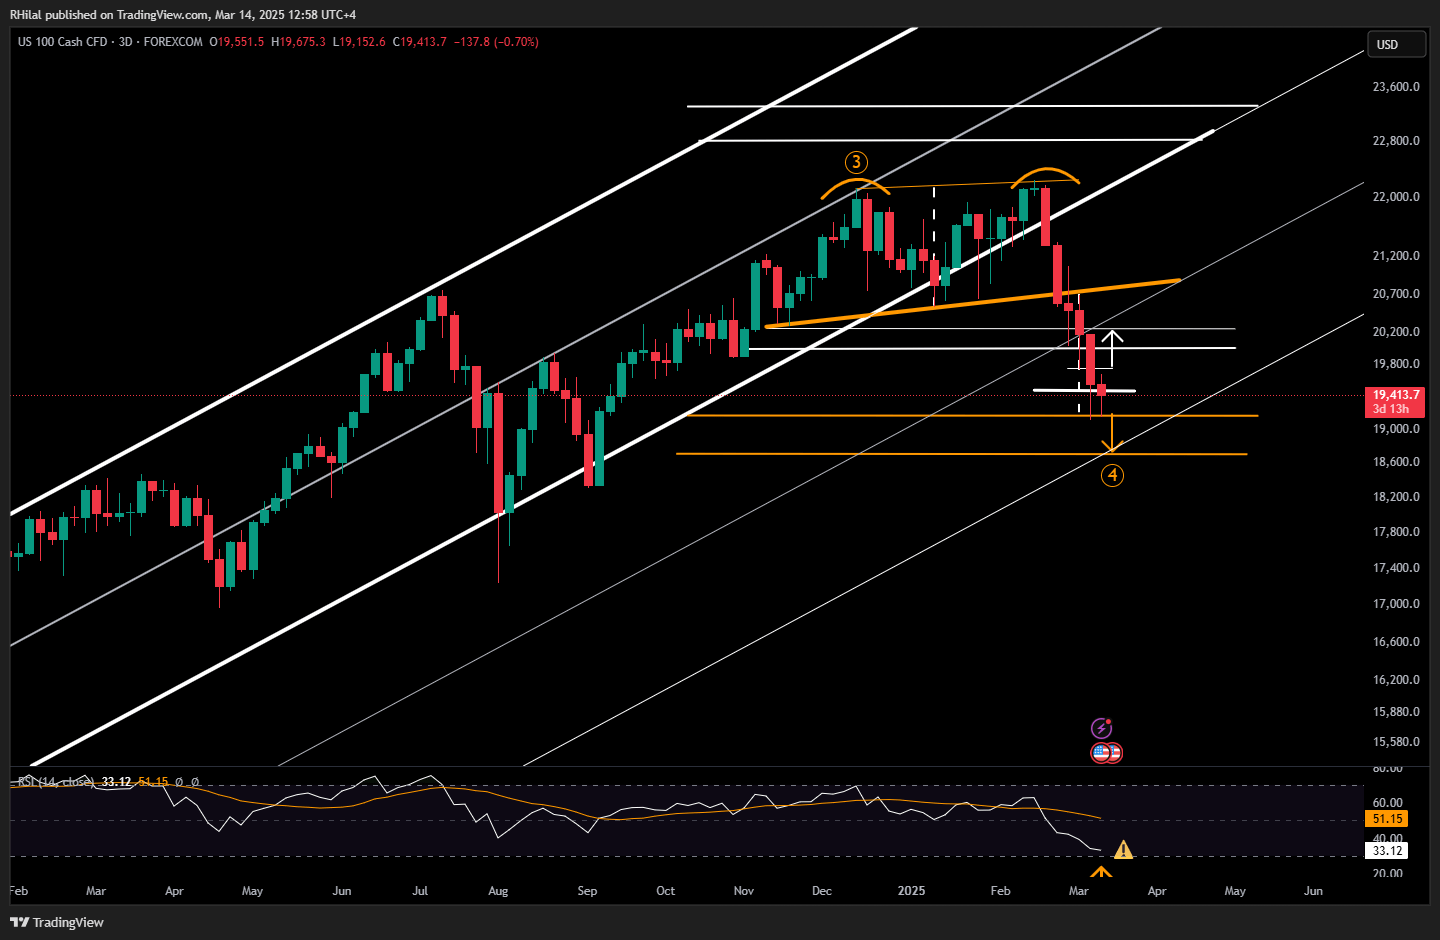
Source: Tradingview
The Nasdaq has reached the double-top pattern target formed between the December 2024 and February 2025 peaks at 19,100. This level also coincides with the 0.618 Fibonacci retracement of the uptrend from the August 2024 low (17,230) to the February 2025 high (22,245). Additionally, oversold conditions on the daily RSI—last observed in August 2024 and previously seen at similar levels in 2022 on the 3-day time frame—further reinforce the significance of this level.
Key Levels to Watch:
Downside Risk: If market turbulence intensifies and the Nasdaq breaks below 19,000, the next critical level is the 0.786 Fibonacci retracement at 18,300, with potential interim support at 18,700.
Upside Potential: If markets react positively to oversold momentum conditions, a break above short-term resistance at 19,700 could trigger rallies toward 20,000, 20,300, 20,700, and 21,000. A sustained breakout above 21,000 could further extend bullish momentum toward record highs.
Written by Razan Hilal, CMT
Follow on X: @RH_waves


Latest market news
Today 08:40 AM
Yesterday 10:12 PM
Yesterday 07:45 PM
Yesterday 07:26 PM
Latest articles

March 25, 2025 05:00 PM

March 25, 2025 01:00 PM

March 24, 2025 03:56 PM

March 24, 2025 12:50 PM