


The price of WTI crude has dropped more than 6% over the past four trading sessions, settling around $67 per barrel, a level not seen since early December 2024. This sharp bearish move has been driven by the potential increase in global production, along with negative factors pointing to weaker demand in 2025. As long as these factors persist, downward pressure on crude oil could continue in the short term.

Factors Supporting Increased Production
Recent data released by the EIA revealed that U.S. commercial crude oil inventories increased by 0.8% in the week ending February 28. This suggests that domestic supply may be rising or, alternatively, that demand is not strong enough to reduce inventories in the short term.
Additionally, OPEC+ surprised the markets by announcing that it will formally implement its planned production increase in April, ending its prolonged series of output cuts. At least eight members of the organization are expected to increase production by approximately 120,000 barrels per day in April, reaching a total increase of 2.2 million barrels per day over the next 18 months. This announcement has heightened market uncertainty, as it implies a significant surge in supply from the world's largest oil-producing alliance.
Another key aspect is the recent meeting between the President of Ukraine and former U.S. President Donald Trump at the White House. After an extensive discussion with no concrete agreements on the ongoing conflict, the possibility of direct negotiations between the White House and Russia has emerged. If the U.S. considers lifting certain sanctions, Russian oil production could see a significant revival. Before the sanctions, Russia had a production capacity of over 10 million barrels per day, which was severely impacted after the war began. A potential peace agreement could further pressure global oil supply as Russia re-enters the market.
Given this backdrop, several factors indicate that production may increase substantially in the coming months, whether from the U.S. or OPEC+. Meanwhile, U.S. trade sanctions have raised concerns about a global economic slowdown, which could reduce crude oil demand. If this trend continues, WTI will face a combination of rising supply and weakening demand, prolonging its bearish pressure in the short term.
Market Confidence Outlook
The OVX (Cboe Crude Oil Volatility Index), which measures the expected 30-day volatility of oil prices, remains above 35 and has shown a recent upward movement.
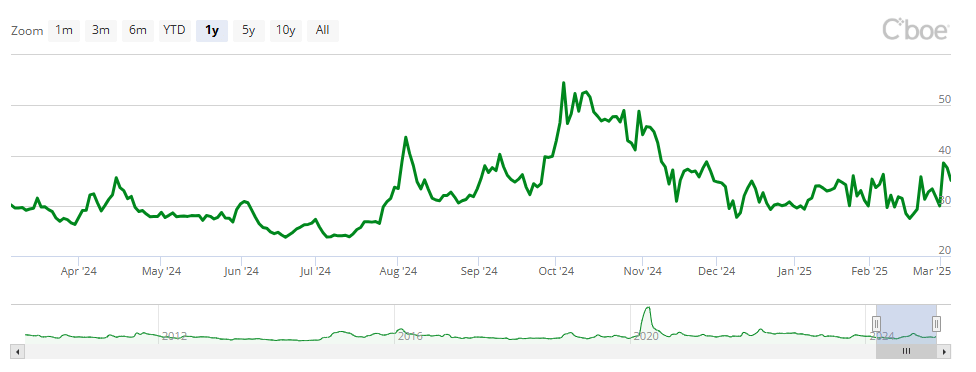
Source: CBOE
A sustained increase in the OVX suggests that the market anticipates greater uncertainty, either due to geopolitical factors or rising oil production. This trend has been evident in recent sessions, where new production announcements have created significant downward pressure on WTI crude.
If the OVX remains at 30 or below, market confidence in crude oil could stabilize. However, if the upward trend persists and the index exceeds 40, uncertainty over oil's future could intensify, leading to further bearish pressure.
WTI Technical Outlook
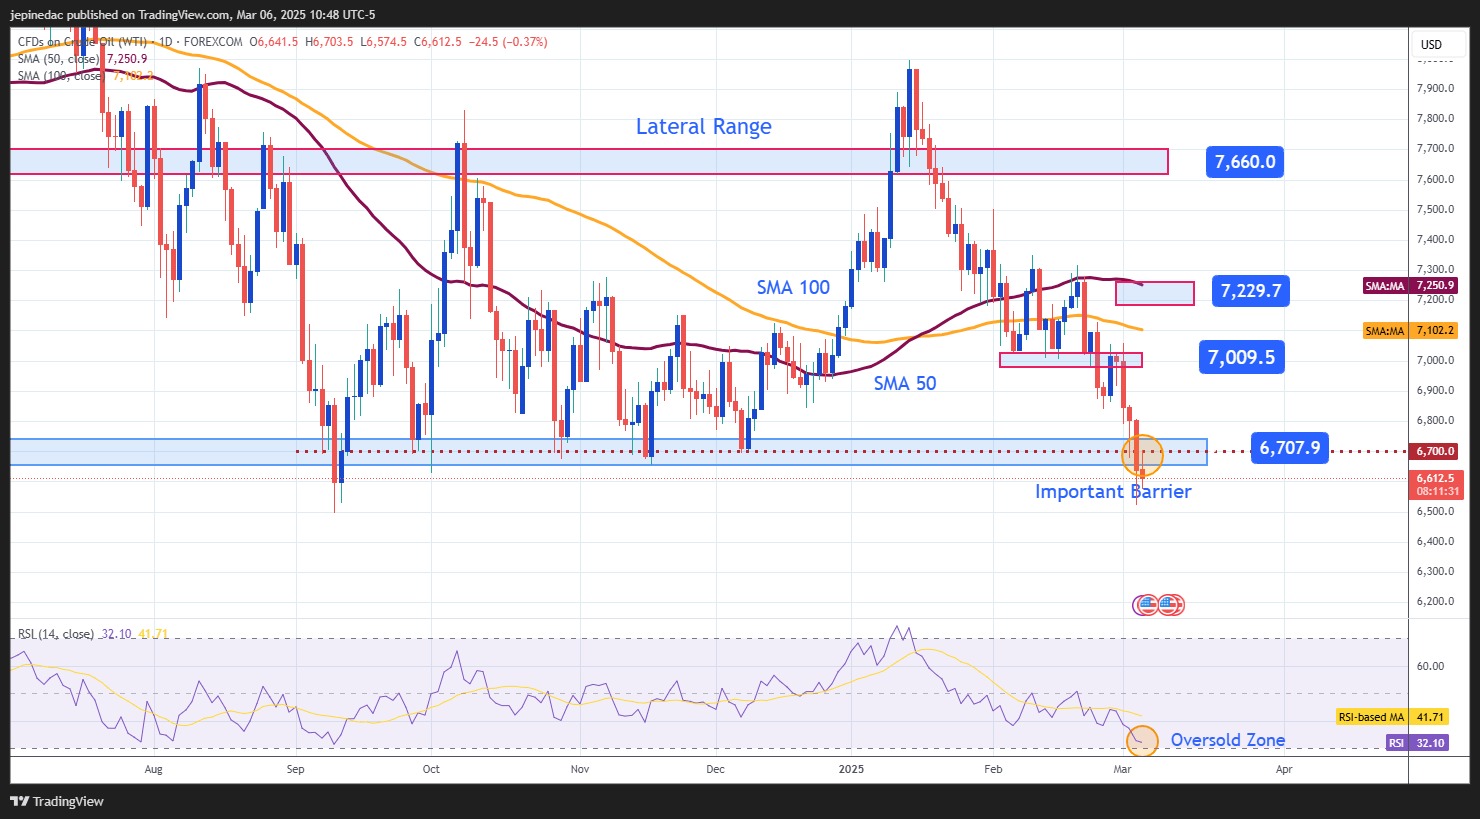
Source: StoneX, Tradingview
- Big Lateral Range: WTI continues to trade within a sideways range, with $76 as resistance and $67 as support. However, the recent accelerated downtrend is testing the lower boundary of the channel. If selling pressure remains strong, the structure could break, signaling the beginning of a new downward trend.
- RSI: The RSI indicator has seen a sharp decline and is approaching the 30 level, which is considered the oversold zone. If the RSI falls below this threshold, it could indicate an imbalance in selling pressure, potentially leading to short-term bullish corrections.
Key Levels:
- $72 – Major Resistance: This level aligns with the 50- and 100-period simple moving averages. A sustained breakout above this level could signal a stronger bullish bias and maintain the ongoing sideways range.
- $70 – Near-Term Resistance: A psychological barrier in the short term where potential bullish corrections could take place in upcoming trading sessions.
- $67 – Critical Support: This level marks the lowest point within the broad sideways range. A breakdown below this support could lead to a complete collapse of the range and trigger a fresh short-term bearish trend.
Written by Julian Pineda, CFA – Market Analyst


Latest market news
Today 11:30 AM
Today 08:40 AM
Yesterday 10:12 PM
Yesterday 07:45 PM
Latest articles

March 17, 2025 05:31 PM

February 24, 2025 04:30 PM

February 10, 2025 04:45 PM

January 29, 2025 04:52 PM