


British Pound Technical Forecast: GBP/USD Weekly Trade Levels
- British Pound breaks out of September downtrend- threatens larger recovery
- GBP/USD key resistance in view- UK employment / inflation data tap
- Resistance 1.2609, 1.2731/73 (key), 1.2924- Support 1.2493, 1.2367/97 (key), 1.2084-1.2114
The British Pound has broken out of a multi-month downtrend with the January rebound extending nearly 4.4% off the yearly low. The advance is testing initial resistance hurdles into the weekly open with the yearly moving average now within striking distance. Battle lines drawn on the GBP/USD weekly technical chart.
Review my latest Weekly Strategy Webinar for an in-depth breakdown of this Sterling setup and more. Join live on Monday’s at 8:30am EST.British Pound Price Chart – GBP/USD Weekly
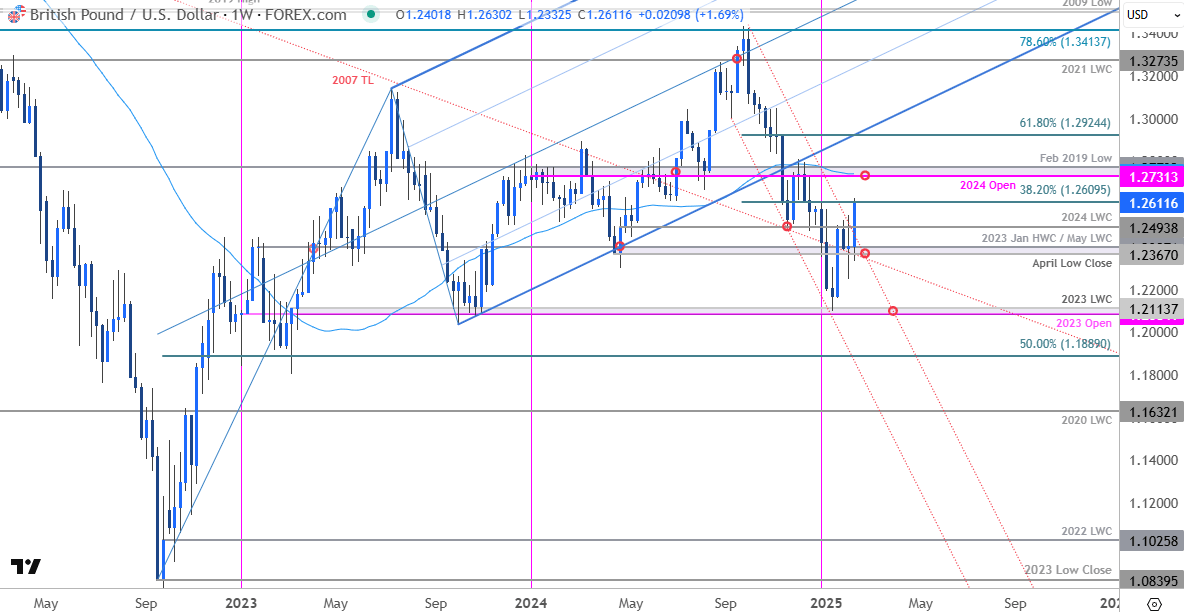
Chart Prepared by Michael Boutros, Sr. Technical Strategist; GBP/USD on TradingView
Technical Outlook: In my last British Pound Weekly Forecast we noted that GBP/USD was, “trading into a major pivot zone- looking for possible price inflection off the 1.2367-1.2397 range. From a trading standpoint, losses would need to be limited to this week’s low IF price is heading for a breakout on this stretch with a close above channel resistance needed to clear the way for a larger advance.” Sterling held the 1.2367/97 support zone with a breakout this week extending more than 3.1% off the monthly low. The rally has now cleared the September channel / downtrend and threatens a lager recovery in the pound.
Initial resistance is being tested here at the 38.2% retracement of the September decline at 1.2609 with more significant resistance zone eyed just higher at 1.2730/73- a region defined by the 2024 objective yearly open, the 52-week moving average, and the February 2019 swing low. Looking for a larger reaction there IF reached with a breach / close above needed to suggest a more significant low was registered last month / a lager reversal is underway. Subsequent resistance objectives eyed at the 61.8% retracement at 1.2924.
Look for initial weekly support rests with the 2024 low-week close (LWC) at 1.2494. Near-term bullish invalidation now set to 1.2367/97- a region defined by the April low close, the 2023 January high-week close (HWC), and the May LWC. Losses below this threshold would invalidate the recent breakout and threaten downtrend resumption. Critical support steady at the 2023 open / LWC at 1.2084-1.2114.

Bottom line: Sterling has broken out of a multi-month downtrend this week with the advance threatening a larger recovery in the weeks ahead. From a trading standpoint, losses should be limited to 1.2367 IF price is heading higher on this stretch – look to reduce long-exposure / raise protective stops on rally towards the 52-week moving average.
Keep in mind we get the release of key employment & inflation data from the UK next week. Stay nimble into the releases and watch the weekly closes here for guidance. Review my latest British Pound Short-term Outlook for a closer look at the near-term GBP/USD technical trade levels.
GBP/USD Economic Data Releases
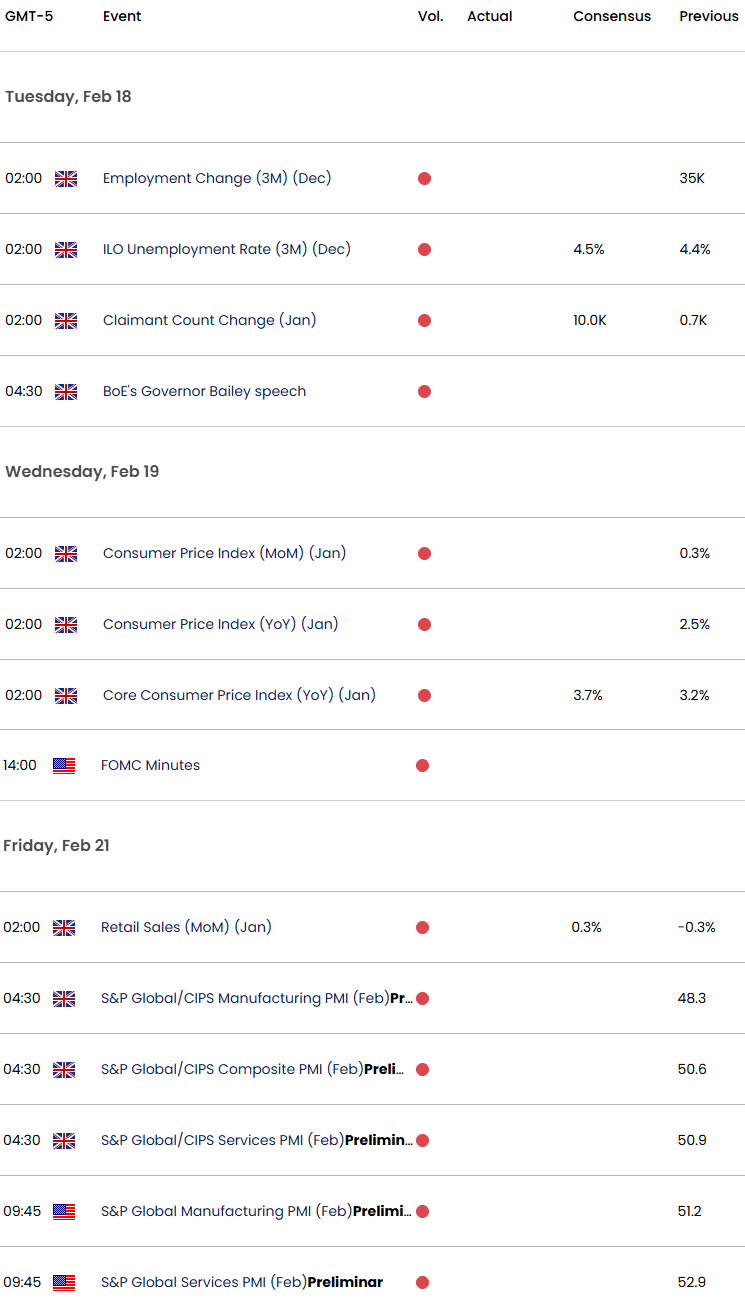
Economic Calendar - latest economic developments and upcoming event risk.
Active Weekly Technical Charts
- Euro (EUR/USD)
- Canadian Dollar (USD/CAD)
- Japanese Yen (USD/JPY)
- Gold (XAU/USD)
- Swiss Franc (USD/CHF)
- US Dollar Index (DXY)
- S&P 500, Nasdaq, Dow
- Australian Dollar (AUD/USD)
- Crude Oil (WTI)
--- Written by Michael Boutros, Sr Technical Strategist with FOREX.com
Follow Michael on X @MBForex


Latest market news
Today 11:30 AM
Today 08:40 AM
Yesterday 10:12 PM
Latest articles

March 3, 2025 04:52 PM

February 19, 2025 01:51 PM

February 18, 2025 07:23 PM

February 15, 2025 08:00 PM