

GBP/USD Talking Points:
- The British Pound was battered in early-2025 trade as GBP sank to fresh yearly lows against the U.S. Dollar.
- What initially started as support defense of the 1.2100 level a week and a half ago has turned into a slight bullish trend, denoted by an upward sloping channel that’s seeing buyers attempting to defend support at a prior spot of resistance around the 1.2300 handle.
- That bullish channel could be setting the stage as a bear flag and, so far, there’s been a hold of resistance at a longer-term Fibonacci level of 1.2367.

It was a rough start to 2025 for the British Pound but the currency is trying to turn the corner. The pair plummeted down for a test of 1.2100 last Monday but that’s around where sellers were stalled. And while bears did hit back on a fast test of 1.2250, they weren’t able to get all the way back down to the prior low and since then, there’s been a bullish build of both higher-highs and lows for the currency pair.
This move has largely adhered within an upward-sloping channel. The recent high was carved out at 1.2367, which is the 76.4% Fibonacci retracement of the 2023-2024 major move in the pair.
But – perhaps more interesting than that is the fact that the pullback from that higher-high has, so far, held higher-low support at another key Fibonacci level of 1.2297, which is the 50% mark of the broader 2021-2022 major move.
GBP/USD Four-Hour Chart
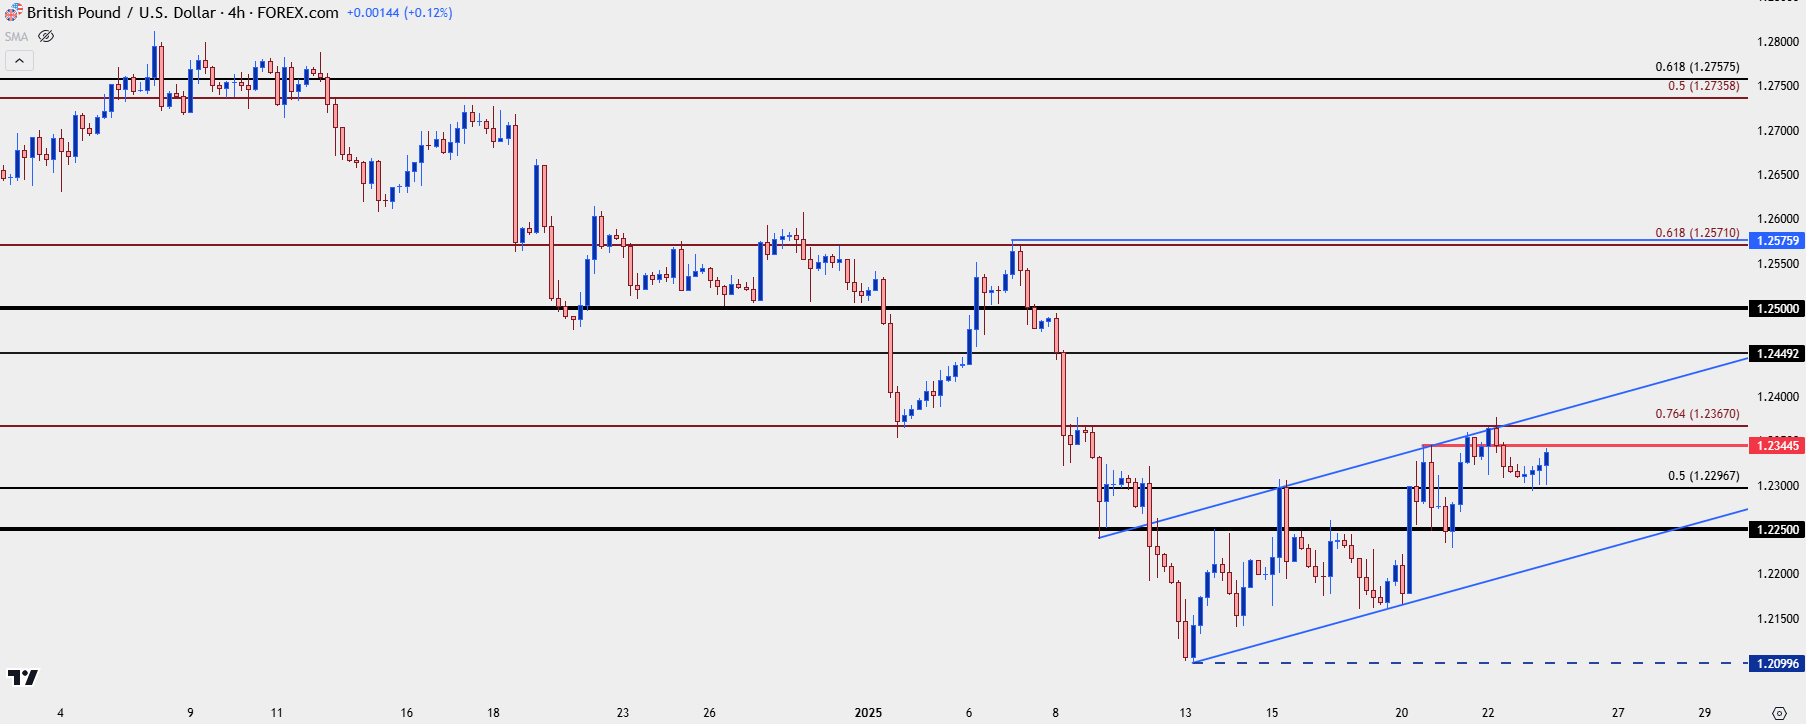 Chart prepared by James Stanley, GBP/USD on Tradingview
GBP/USD Daily Chart
The daily chart provides some important context here as the bounce move is still very early, and this may be a mere correction from oversold conditions that flashed again last Friday. But, that wasn’t the first oversold reading we’ve seen on the daily chart of Cable, and there’s been a building case of divergence since November as the lower-lows in price have matched up with higher-lows via RSI. That’s a factor that can open the door for broader reversal potential.
For resistance, I’m tracking a big level at 1.2500 which has had some historical relevance in the pair. For shorter-term levels, the 23.6% retracement of the recent bearish trend plots at 1.2415, and that can present an opportune area to gauge buyer aggressiveness. If that level comes into play as a higher-high, the corresponding pullback would ideally hold above the 1.2297 level that’s helping to form today’s low; but it would be even more optimistic if current resistance at 1.2367 did that instead.
GBP/USD Daily Chart
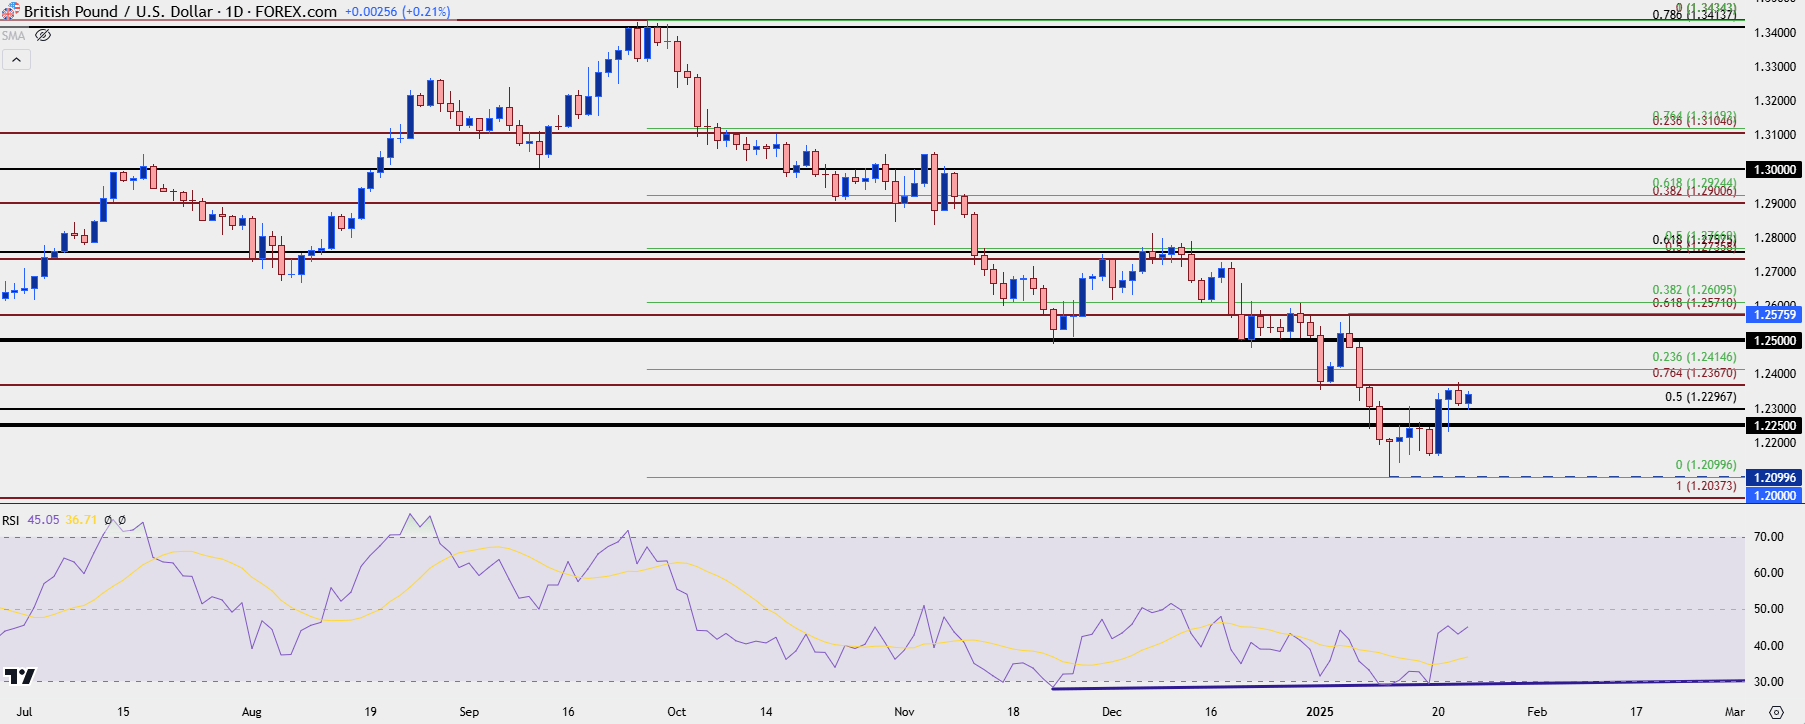 Chart prepared by James Stanley, GBP/USD on Tradingview
--- written by James Stanley, Senior Strategist


Latest market news
Today 11:30 AM
Today 08:40 AM
Yesterday 10:12 PM
Latest articles

Today 11:30 AM


Yesterday 10:12 PM