


View related analysis:
- Nasdaq 100 Forecast: Asset Managers Ramp Up Bearish Tech Bets
- EUR/USD forecast: Its pre-ECB surge did not come without a warning
- Bullish Bets on the Euro and Yen Continue to Rise: COT Report
- AUD/USD weekly outlook: 10 March 2025
ASX 200 at a glance
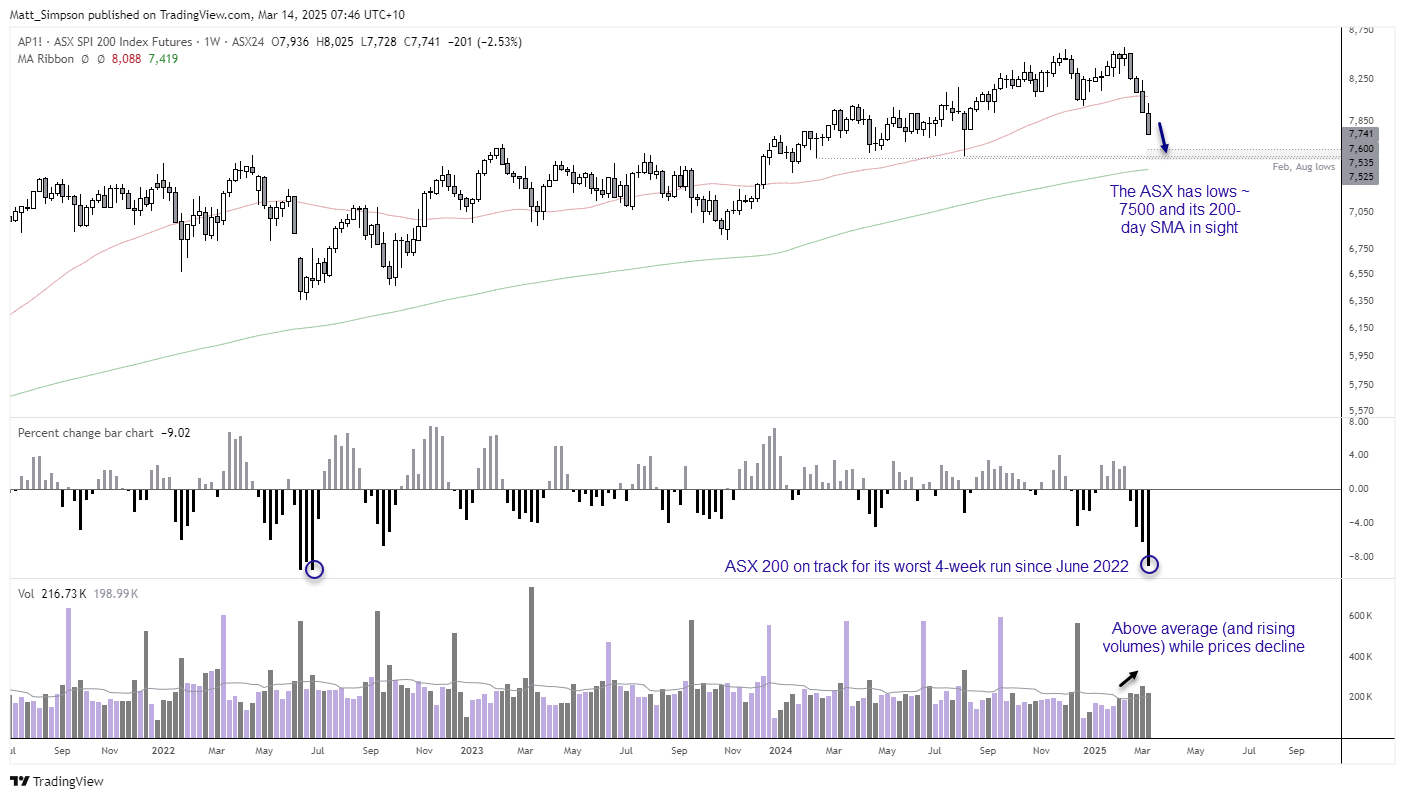
- The ASX 200 is on track for a fourth consecutive bearish week (first since March 2023)
- All 11 ASX 200 sectors are in the red this month, with financials, consumer discretionary and energy leading the way lower with losses ion excess of 7% so far
- The ASX 200 has closed lower 7 of the past 8 days,
- Not helping this week is the hefty amount of dividends being paid out to ASX shareholders
- Still, only 50.5% (101) ASX 200 stocks closed lower on Thursday, so perhaps ASX bulls might be treated to a post-dividend bounce at some stage soon

ASX 200 technical analysis
The ASX 200 has not been spared by the stock rout stemming from Wall Street, which currently sits at a 31-week low. Currently on track for its worst 4-week run in 33-months, volumes have been trending higher and above average in recent weeks. Dare I say the index has the lows ~7500 in focus, a break of which brings the 200-day average into focus at 7419.

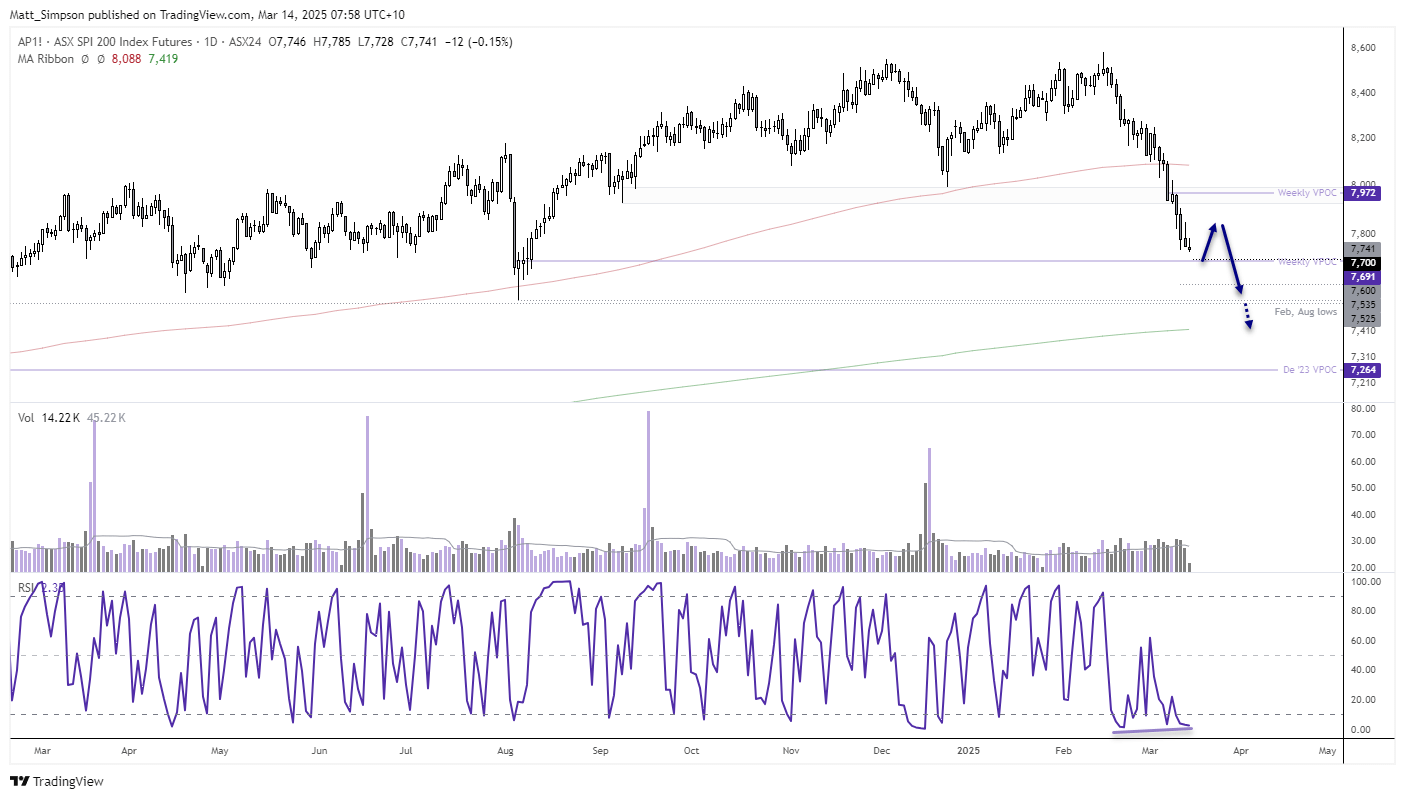
However, the move lower is looking extended on the daily chart, and daily volumes were below average for the past two days. Moreover, and inverted hammer formed on Thursday, and the overnight range was also low despite losses on Wall Street. And as we have the 7700 handle and weekly VPOC (volume point of control) at 7691 nearby, bears may want to tread carefully around these low after such a strong move.
Still, bears seem more likely to fade into bounce than not, unless gifted with an unexpectedly bullish catalyst. And that means bears will keep their eyes on the prize for a break below 7600 and 7500 for a retest of the 200-day SMA.
ASX 200 correlations
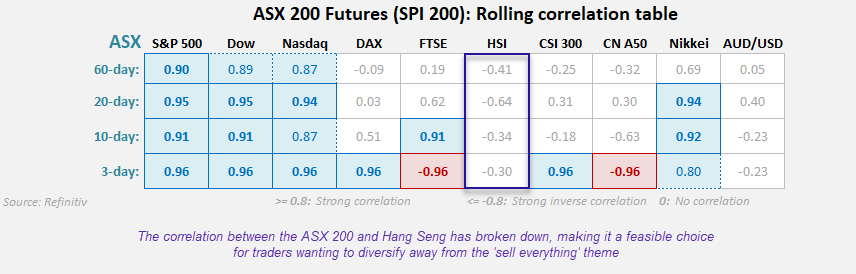
Last I checked, global indices were tightly correlated on this dashboard. But that is clearly no longer the case. While the ASX continues to share a strong positive correlation with Wall Street indices such as the S&P 500, Nasdaq 100 and Dow Jones, longer-term correlations (20 to 60-day) are non-existent with Europe and parts of Asia.
I suspect the two main reasons that the ASX is tracking the Nikkei so well is because Japan’s tech-savvy index is closely tied to the Nasdaq, and bets of Bank of Japan (BOJ) hikes are also weighing on the Nikkei.
What has really caught my eye is how the ASX effectively has no correlation whatsoever with the Hang Seng (HSI), and that makes it an ideal index to consider if one seeks to diversify away from the ‘sell everything’ theme that currently plagues Wall Street.
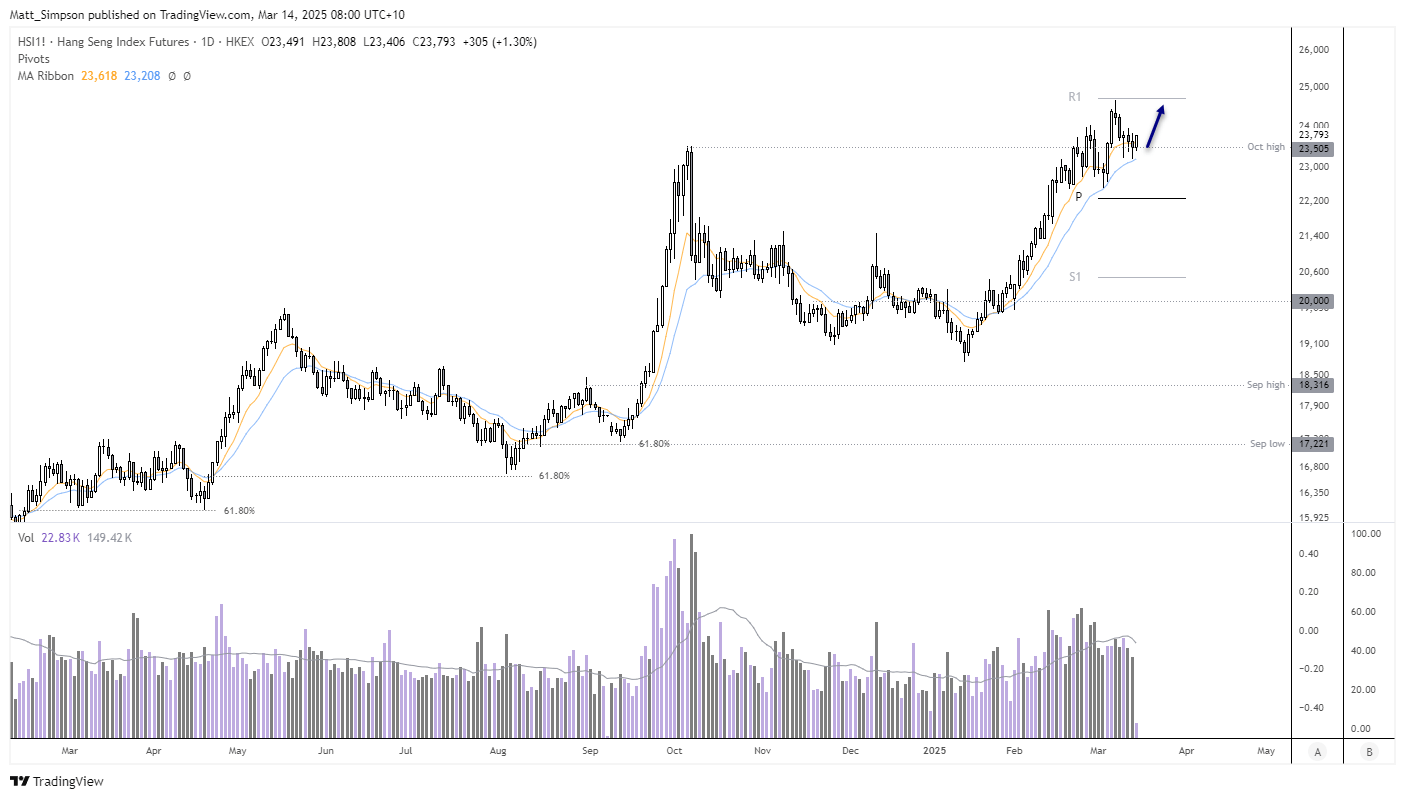
Hang Seng technical analysis
This is a simple setup which aims to seek another upswing in a strong uptrend. Prices peaked just beneath the monthly R1 pivot last week, although support has since been found at the 20-day EMA. Volumes were lower over the past two days to suggest a lack of bearish enthusiasm. The Hang Seng also closed above the October high.
The bias is now for a break above 24k and retest (and possible continuation above) the monthly R1 pivot, while prices remain above the 20-day EMA.
Economic events in focus (AEDT)
- 08:30 – New Zealand business PMI
- 18:00 – UK GDP m/m, Index of Services, Construction Output, Manufacturing Output, Industrial Production, Trade Balance
- 18:00 – German inflation
- 18:45 – French inflation
- 19:00 – Spanish Inflation
- 19:30 – UK Inflation Expectations
- 20:00 – Chinese New Loans, Outstanding Loan Growth, Social Financing, M2 Money Stock
- 23:30 – Canadian Manufacturing Sales
- 01:00 – US Consumer Sentiment, Inflation Expectations (Michigan University)
View the full economic calendar
-- Written by Matt Simpson
Follow Matt on Twitter @cLeverEdge


Latest market news
Today 08:40 AM
Yesterday 10:12 PM
Yesterday 07:45 PM
Yesterday 07:26 PM
Latest articles

March 25, 2025 08:49 PM

March 24, 2025 10:31 PM
March 20, 2025 10:26 PM
March 19, 2025 10:01 PM